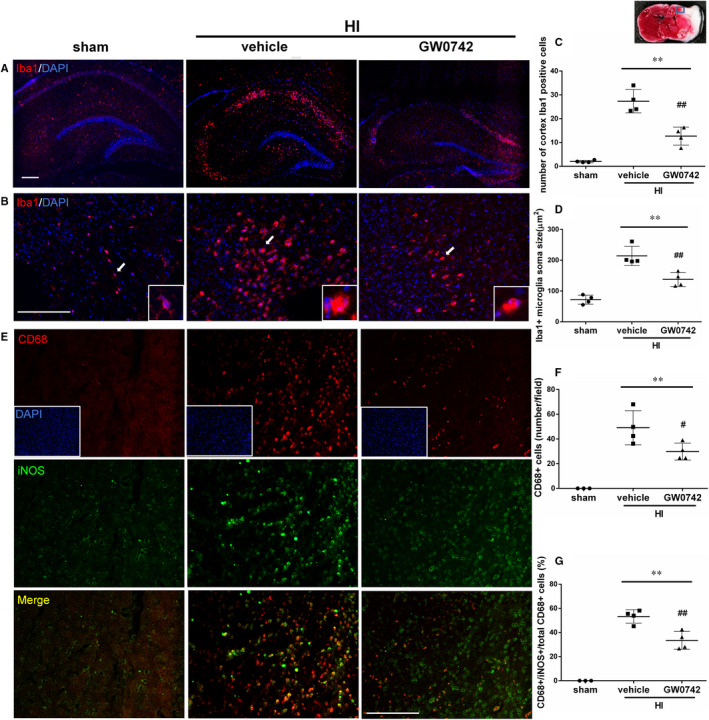
FIGURE 4.

GW0742 suppresses pro‐inflammatory microglia activation at 72 h after HI. A, Representative images of Iba‐1‐positive microglia in the hippocampus of ipsilateral hemisphere of sham, vehicle‐treated and GW0742‐treated HI rats. Red is for Iba‐1 and DAPI (blue) stains for cell nucleus. B, Representative images of Iba‐1‐positive microglia in cerebral cortex of ipsilateral hemisphere of sham, vehicle‐treated and GW0742‐treated HI rats. Arrows indicate cells, which are shown in higher magnification in the insets. C, Quantitative cell counts of Iba‐1‐ positive microglia and (D) measurements of microglia soma size in the ipsilateral cortex of sham, vehicle and GW0742‐treated HI rats. n = 4. E, Representative images of CD68 (for activated microglia) and iNOS (proinflammatory microglia) stained microglia in the cerebral cortex of ipsilateral hemisphere of sham, vehicle‐treated and GW0742‐treated HI rats. F, Quantitative cell counts of CD68‐positive activated microglia and G, double positive CD68/iNOS + cells percentage of pro‐inflammatory microglia. n = 4. Data are presented as the mean ± SD. **P < 0.01 vs sham, # P < 0.05 vs HI + vehicle, ## P < 0.01 vs HI + vehicle. ANOVA with post hoc Tukey multiple comparison test. Scale bar‐ 200 μm
