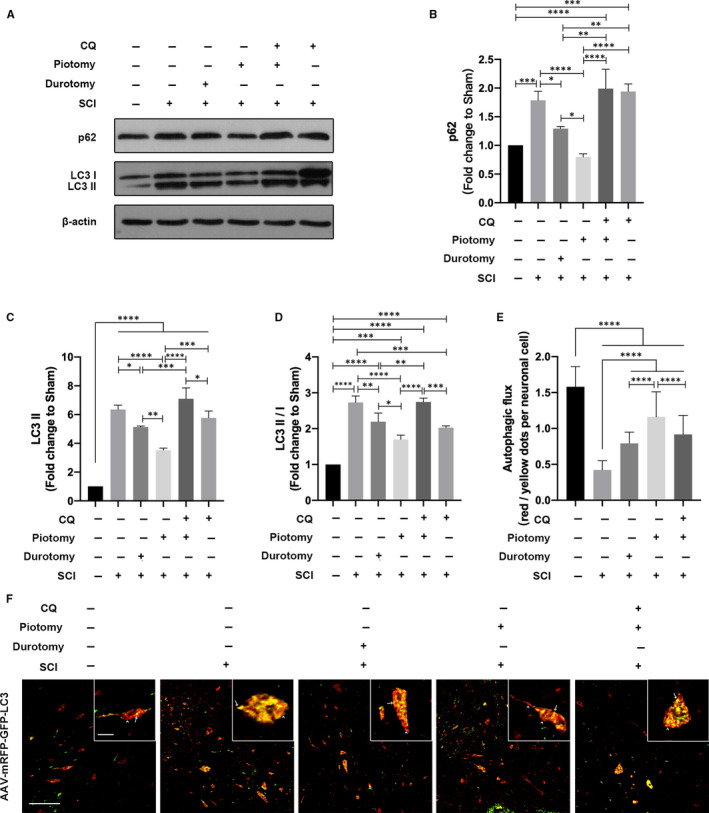
Figure 3.

Decompression restored autophagic flux after SCI, whereas autophagic flux was impaired after CQ administration. A‐D, Western blotting and quantitative analysis of changes in p62 and LC3 expression in rabbits. The data are presented as the means ± SDs, n = 3. One‐way ANOVA followed by Tukey's multiple comparisons test. *P < .05, **P < .01, ***P < .001 and ****P < .0001. E and F, Images of spinal cord sections obtained from rabbits injected with AAV‐mRFP‐GFP‐LC3. The arrowheads indicate red dots. The arrows indicate yellow dots. Scale bar = 100 μm (10×). Scale bar = 10 μm (40×). The autophagic flux (red/yellow dot ratio per cell) in neuronal cells was quantified. The data are presented as the means ± SDs, n = 5. One‐way ANOVA followed by Tukey's multiple comparisons test. ****P < .0001
