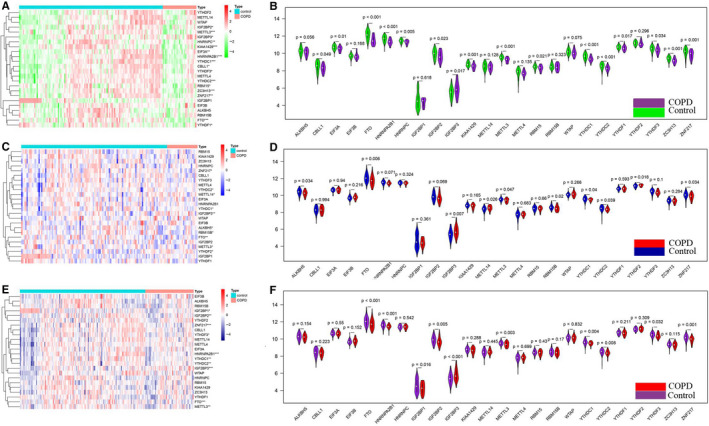
FIGURE 1.

Expression of m6A RNA methylation regulators between healthy controls and COPD cases. A and B, Heat map and violin diagram of expression levels of 24 m6A RNA methylation regulators (healthy control sample vs COPD sample) from train group. C and D, Heat map and violin diagram of expression levels of 24 m6A RNA methylation regulators from validation group 1. E, F, Heat map and violin diagram of expression levels of 24 m6A RNA methylation regulators from validation group 2
