
FIGURE 1.
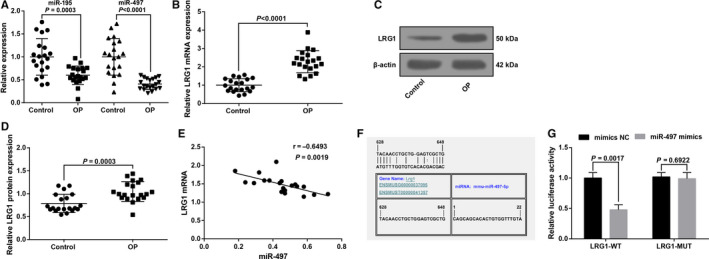
MiR‐497 expression reduces and LRG1 expression increases in femoral head tissues of patients with osteoporosis. A, MiR‐497 expression in femoral head tissues in control and osteoporosis; B, LRG1 mRNA expression in femoral head tissues in control and osteoporosis; C, LRG1 protein bands in femoral head tissues in control and osteoporosis; D, LRG1 protein expression in femoral head tissues in control and osteoporosis; E, Pearson's analysis of the correlation between miR‐497 and LRG1 in femoral head tissues in osteoporosis patients; F, schematic diagram of the miR‐497 binding site in the LRG1 based on RNA22 software; G, luciferase activity verification; in figure A‐E, control group (n = 20), osteoporosis group (n = 20); in Figure G, N = 3. The data were expressed as the mean ± standard deviation. Comparisons between two groups were analysed by unpaired t test; In Figure E, Pearson correlation analysis was performed