Figure 1.

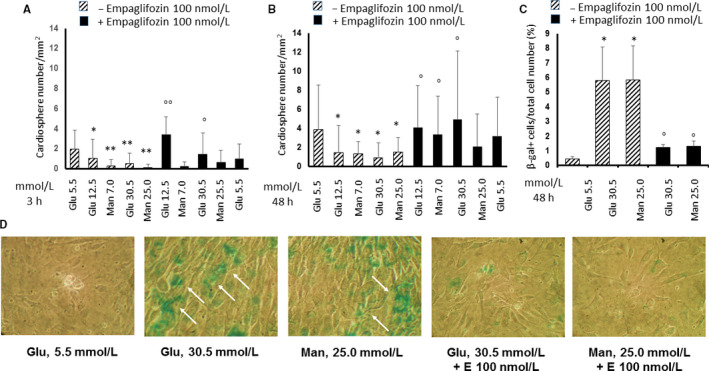
Effects of high glucose and high mannitol with or without empagliflozin on cardiosphere number and senescence of murine cardiac stromal cells. Panels A and B, Quantitation of murine cardiospheres in multiple microscope fields, treated with normal glucose (5.5 mmol/L) or high glucose (12.5 and 30 mmol/L) or high mannitol (7.0 and 25 mmol/L) for 3 h (panel A) and 48 h (Panel B), in the presence or absence of 100 nmol/L empagliflozin. The graph bars showing the total number of cardiospheres over 5 microscope fields per sample represent means ± standard deviations (n = 3 independent experiments). Panel C, Quantitation of senescent cells in multiple microscope fields from murine cardiac stromal cells (CSC) treated with low (5.5 mmol/L) or high glucose (30 mmol/L) or high mannitol (25 mmol/L) for 48 h, in the presence or absence of 100 nmol/L empagliflozin. The graph bars, showing the ratio between the number of senescence‐associated β‐galactosidase (SA‐βGal) positive cells and the total number of cells over 5 microscope fields per sample, represent means ± standard deviations (n = 3 independent experiments). Panel D, Representative SA‐βGal staining images of CSC treated with normal glucose (5.5 mmol/L) or high glucose (30 mmol/L) or high mannitol (25 mmol/L) for 48 h, in the presence or absence of 100 nmol/L empagliflozin, as indicated by the blue staining (arrows). All images are shown at 10× magnification. *P < .05 and **P < .01 vs. normal glucose; ° P < .05 and °° P < .01 vs without empagliflozin. E, empagliflozin; Glu, glucose; Man, mannitol; SA‐βGal, senescence‐associated β‐galactosidase
