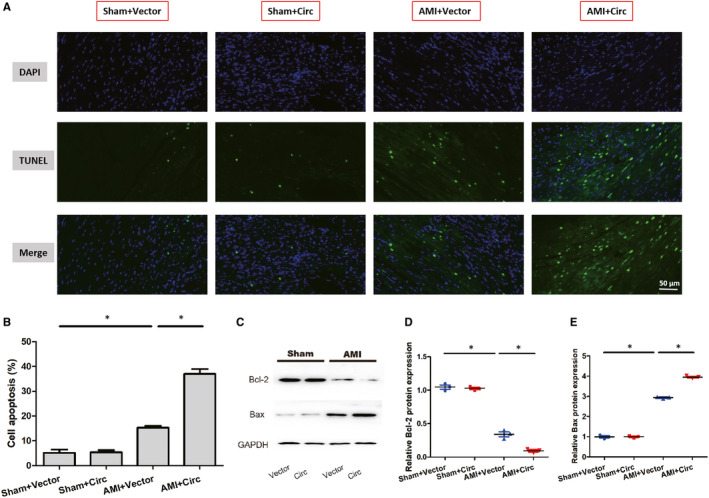
FIGURE 4.

Overexpression of circ_0060745 promoted apoptosis after AMI. (A) Cell apoptosis assessed by TUNEL staining. Scale bar: 50 μm. (B) The proportion of apoptotic cells calculated as the percentage of TUNEL‐positive cells. (C‐E) The protein expression of Bcl‐2 and Bax measured by Western blot at 3 d after AMI. Asterisks indicated statistical significance for AMI + sh‐NC vs Sham + sh‐NC and AMI + sh‐Circ vs AMI + sh‐NC. Data are shown as means ± SD. *, P < 0.05
