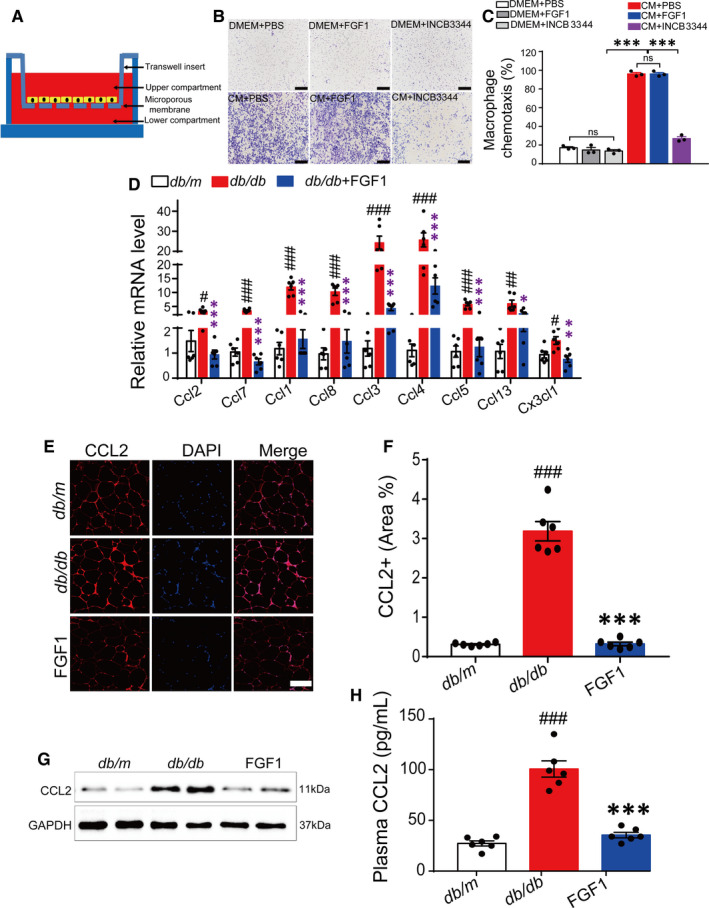
FIGURE 5.

FGF1 inhibits macrophages migration by negatively controlling CCL2 transcription and expression. A, A schematic diagram showing the co‐culture of adipocytes and macrophages in vitro. B and C, The representative image of the effect of FGF1 (100 ng/mL) and INCB3344 (specific inhibitor of CCR2, 100 nmol/L) on 3T3‐L1 CM‐induced chemotaxis of macrophages (B) and the quantitative analysis (C). The image was representative of similar results from three independent experiments. Scale bar represents 1000 μm for 100×. D, The relative mRNA level of chemokines in eWAT of db/db mice after chronic administration of FGF1. E and F, Representative confocal merged images of CCL2 from epididymal adipose tissue of db/db mice, stained with anti‐CCL2 (red) and DAPI (blue), and the data of quantitative analysis of staining of db/db mice was conducted by ImageJ software. G, Western blot analysis of CCL2 in epididymal adipose tissue of db/db mice after treatment with FGF1. H, The plasma CCL2 level of db/db mice after treatment with FGF1. *P < .05, **P < .01, ***P < .001, FGF1 vs db/db. # P < .05, ## P < .01, ### P < .001, db/db vs db/m
