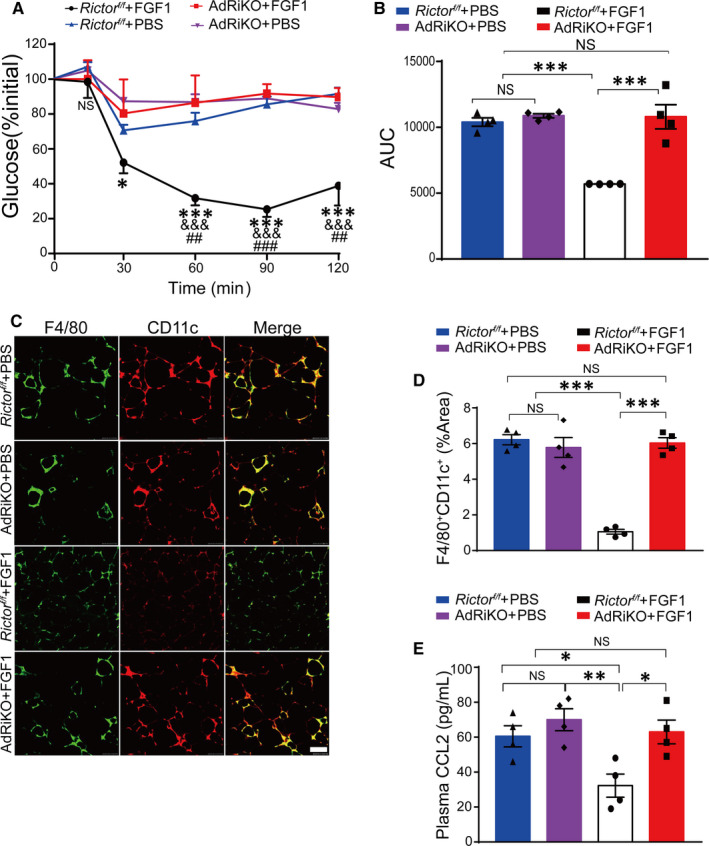
FIGURE 7.

FGF1 fails to improve insulin resistance in diet‐induced AdRiKO obese mice. A, Insulin tolerance test (ITT) of AdRiKO and R ictorf/f obese mice after treatment with FGF1 or PBS. Data are presented as mean ± SEM (n = 4). *P < .05, **P < .01, ***P < .001, R ictorf/f + HFD + FGF1 vs AdRiKO + HFD + FGF1. & P < .05, && P < .01, &&& P < .001, R ictorf/f + HFD + FGF1 vs rictorf/f + HFD + PBS. # P < .05, ## P < .01, ### P < .001, R ictorf/f + HFD + FGF1 vs AdRiKO + HFD + PBS. B, The area under the curve of ITT (AUC) of the AdRiKO obese mice after chronic treatment with FGF1 and PBS. Data are presented as mean ± SEM (n = 4). *P < .05, **P < .01, ***P < .001, R ictorf/f + HFD + FGF1 vs AdRiKO + HFD + FGF1 or AdRiKO + HFD + PBS or R ictorf/f + HFD + PBS. C, Representative confocal merged images of epididymal fat pads from AdRiKO and Rictorf/f fed with high‐fat diet, co‐stained with anti‐F4/80 (green) and CD11c (red), and the quantitative analysis data of double staining (D) were conducted by ImageJ software. Scale bar represents 500 μm for 200×. Data are presented as mean ± SEM (n = 4). *P < .05, **P < .01, ***P < .001, Rictorf/f + HFD + FGF1 vs AdRiKO + HFD + FGF1 or AdRiKO + HFD + PBS or Rictorf/f + HFD + PBS. E, The plasma CCL2 level of AdRiKO and Rictorf/f mice after treatment with FGF1 or PBS. Data are presented as mean ± SEM (n = 4). *P < .05, **P < .01, ***P < .001, Rictorf/f + HFD + FGF1 vs AdRiKO + HFD + FGF1 or AdRiKO + HFD + PBS or Rictorf/f + HFD + PBS
