
FIGURE 1.
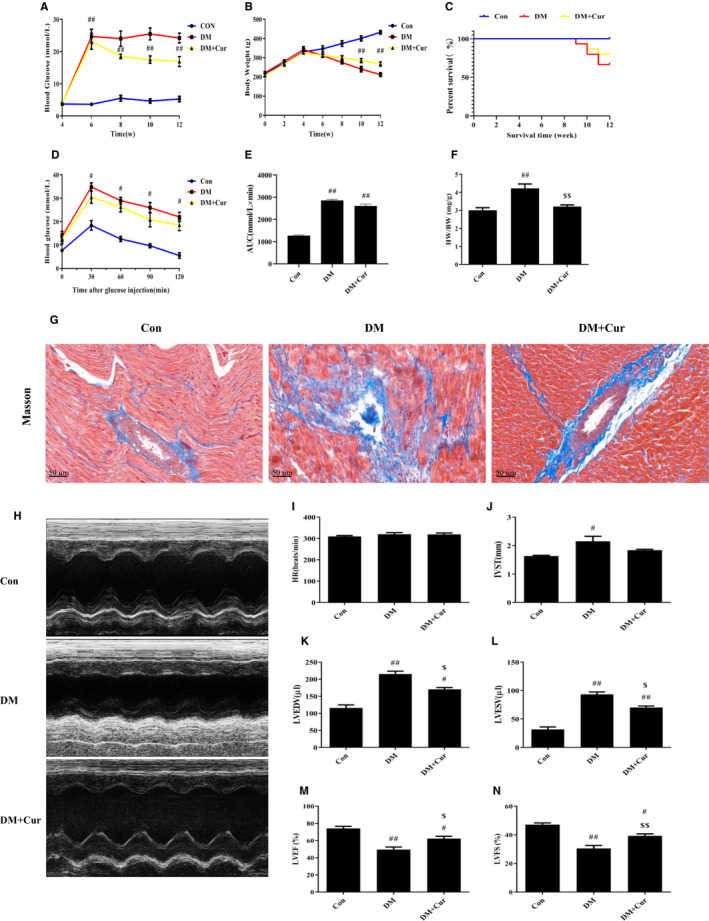
Rats were treated and measured in different groups. The results of blood glucose (A), body weight (B), survival curve (C) and oral glucose tolerance test (D) in different groups were showed in different colours: Con (blue), DM (red), DM + Cur (yellow). (E) area under the curve (AUC) (mmol/L × min). (F) Heart‐to‐body weight ratio (HW/BW) (mg/g). (G) Masson trichrome stain of collagen deposition around the cardiovascular. (H‐N) Cardiac function including heart rate (HR) (beats/min), interventricular septum thickness (IVST) (mm), left ventricular end diastolic volume (LVEDV) (μL), left ventricular end systolic volume (LVESV) (μL), left ventricular ejection fraction (LVEF) (%), left short‐axis fractional shortening (LVFS) (%) and M‐mode images by echocardiographic detection. # P < 0.05, ## P < 0.01 compared with Con; $ P < 0.05, $$ P < 0.01 compared with DM