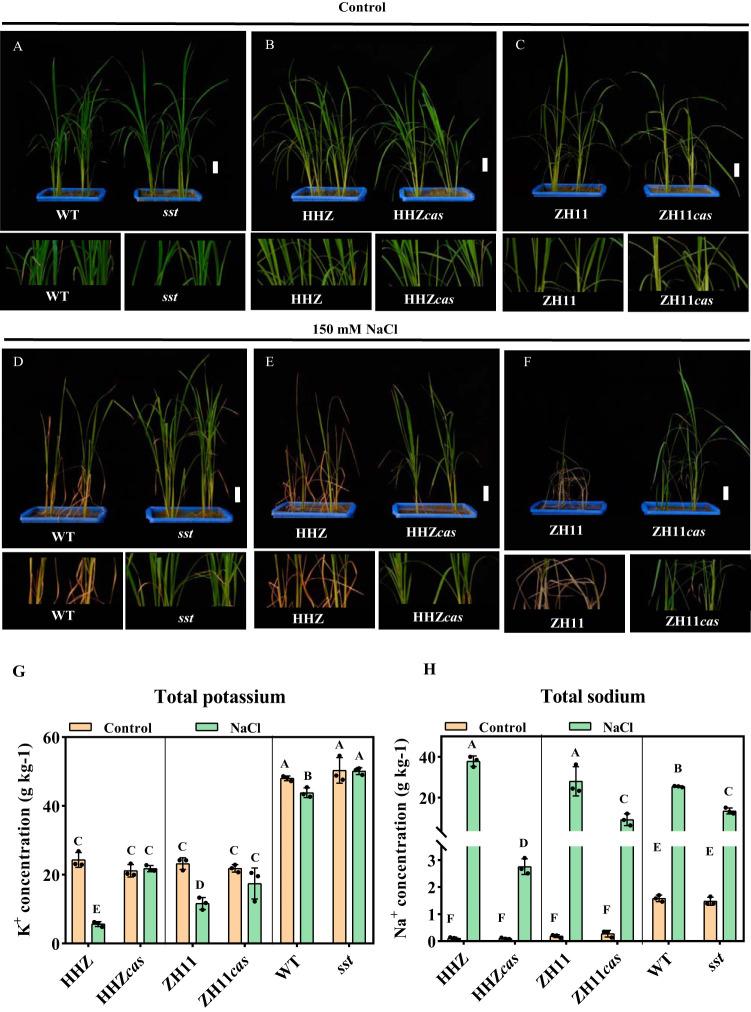
FIG 1.
Phenotypes of WT, mutant (sst), HHZ, HHZcas, ZH11, and ZH11cas rice plants after 20 days of control treatment (A to C) or 150 mM NaCl salt treatment (D to F). Size bars = 50 mm. The bottom of the image is divided into the corresponding local enlarged image. The control treatment was pure water. (G) K+ concentrations among the HHZ, HHZcas, ZH11, ZH11cas, WT, and sst plants. (H) Na+ concentrations among the HHZ, HHZcas, ZH11, ZH11cas, WT, and sst plants. One-way ANOVA, n = 3, P < 0.05.

