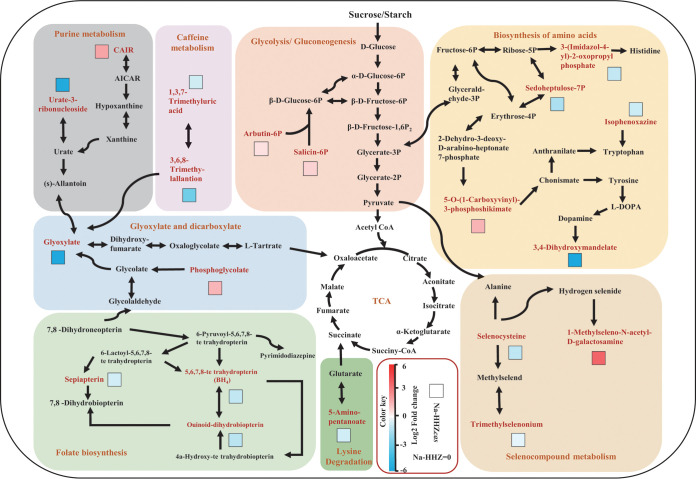
FIG 5.
Screening for maps of metabolic pathways involved in key differentially expressed metabolites. The log2 fold change (HHZ versus HHZcas) of each metabolite is displayed in the form of a heat map from low (blue) to high (red) as presented in the color scale. The box indicates the HHZcas plants treated with 150 mM NaCl.

