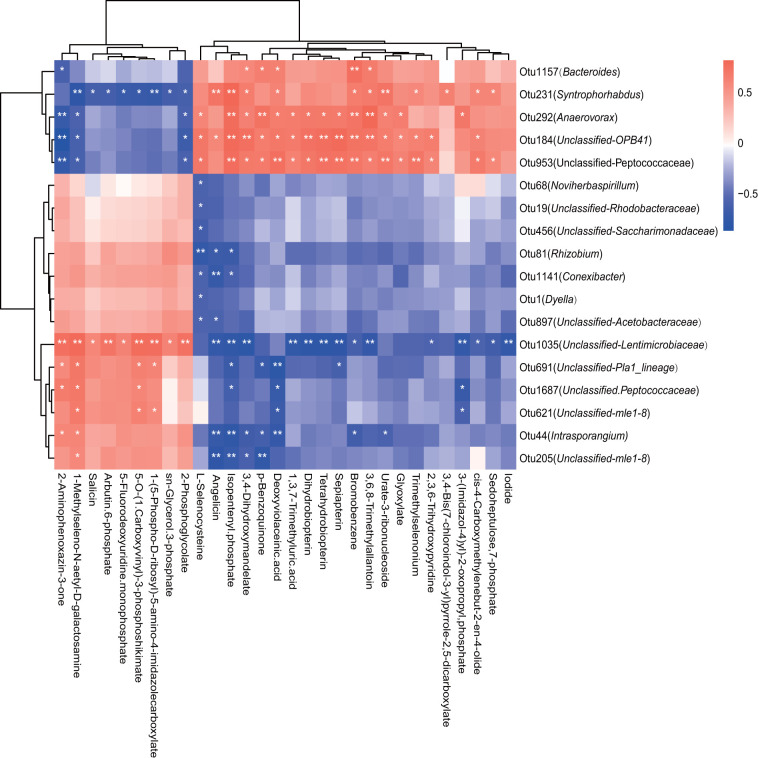
FIG 6.
Correlation analysis between microbes and soil metabolites with significant differences between HHZ and HHZcas plants under the salinity condition. Red boxes represent positive correlations, while blue boxes represent negative correlations (Pearson's correlation, n = 6, P < 0.05). White asterisks indicate statistical significance: *, P < 0.05; **, P < 0.01.

