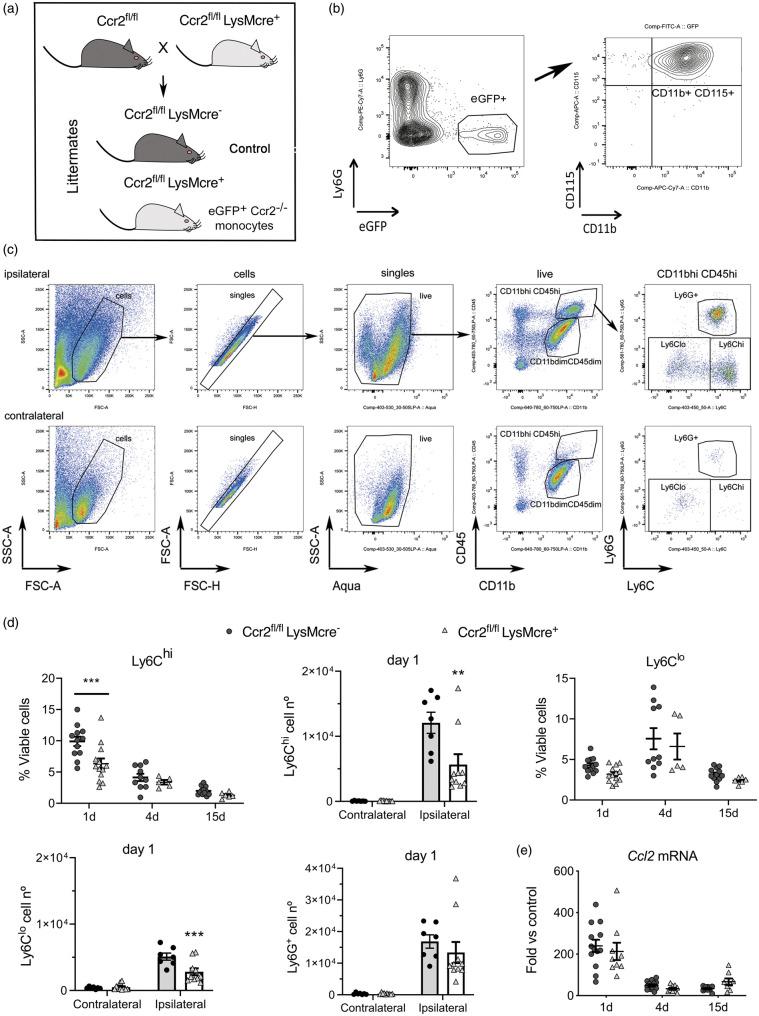
Figure 2.
CCR2 deficiency in monocytes reduces monocyte infiltration to the ischemic tissue. We conditionally targeted Ccr2 gene expression by Cre-mediated recombination crossing LysMcre+ mice with floxed CCR2 mice (Ccr2fl/fl) that express reporter eGFP.31 (a) The study was conducted in littermate Ccr2fl/flLysMcre+ and Ccr2fl/flLysMcre– mice (control). (b) We verified that blood eGFP+ cells in the Ccr2fl/flLysMCre+ mice were monocytes: CD11b+CD115+Ly6G–. (c) Gating strategy to study monocytes and neutrophils in the contralateral and ipsilateral cortex. Images correspond to 1 day after ischemia. We separated monocytes with high Ly6C expression (Ly6Chi) from monocytes with dim or negative Ly6C expression (collectively termed Ly6Clo). (d) We studied monocyte subsets infiltrating the brain tissue at different time points after induction of ischemia, i.e. 1, 4 and 15 days, by flow cytometry in mice of both genotypes (n = 5–12 mice per time point and genotype). Ly6Chi and Ly6Clo monocytes increased after ischemia in the ipsilateral (ischemic) but not the contralateral cortex. The % of CD45hiCD11bhiLy6G–Ly6Chi cells is lower in Ccr2fl/flLysMcre+ mice one day post-ischemia (Two-way ANOVA by genotype and time point followed by Sidak’s multiple comparisons test, ***p < 0.001). The number of Ly6Chi monocytes decreases in the ipsilateral cortex in Ccr2fl/flLysMCre+ mice at day 1 (two-way ANOVA by genotype and brain region followed by Sidak’s multiple comparisons test; ***p < 0.001). The % of CD45hiCD11bhiLy6G–Ly6Clo cells also tend to decrease in Cre+ mice (two-way ANOVA by genotype and time point, genotype effect p = 0.06), and the absolute cell number at day 1 is lower in Ccr2fl/flLysMCre+ mice (two-way ANOVA by genotype and brain region followed by Sidak’s multiple comparisons test; ***p < 0.001). However, the numbers of infiltrating Ly6G+ neutrophils are no different between genotypes. (e) Ccl2 mRNA expression in the ischemic brain tissue at different time points after ischemia shows the highest increase at day 1 versus 4 or 15 days, but there are no differences between genotypes (n = 8–14 mice per time group and genotype). Values are expresses as fold versus non-ischemic contralateral hemisphere of the control genotype.

