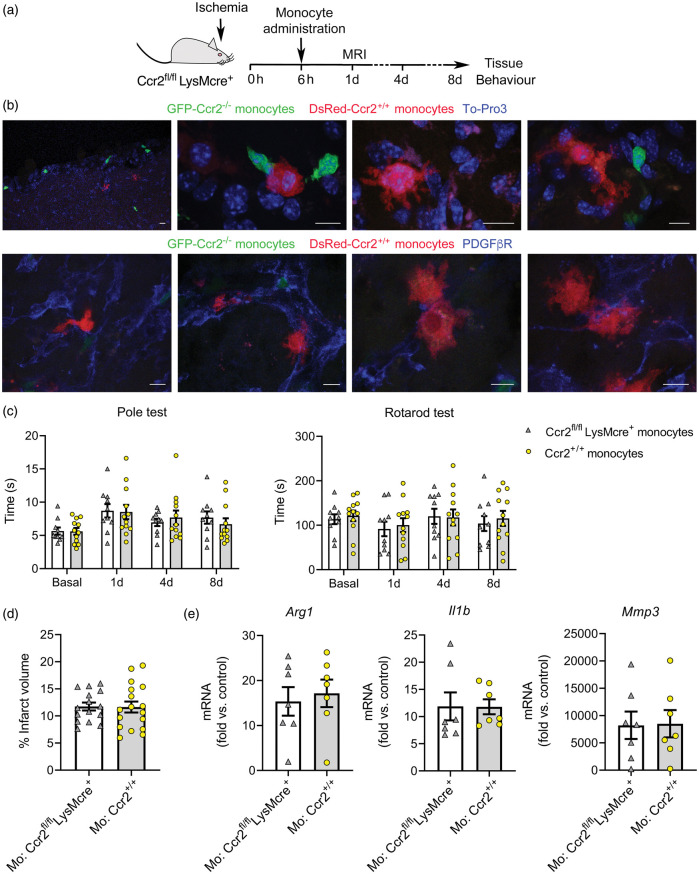
Figure 7.
Administration of bone marrow monocytes is not beneficial. (a) Mice with CCR2-deficient monocytes (Ccr2fl/flLysMcre+) received i.v administration of bone marrow monocytes through the tail vein 6 h post-ischemia. (b) We administered CCR2+ monocytes obtained from reporter fluorescent DsRed mice for microscopic visualization. DsRed monocytes (red) are seen in the core of the lesion eight days post-ischemia (n = 5). The images also show endogenous eGFP+ monocytes (Ccr2gfp/gfp) (green) of the recipient CCR2fl/flLysMcre+ mice. Images in the first raw are stained with To-Pro3 (blue) to illustrate the cell nuclei. Images in the second raw are stained with PDGFβR (blue). DsRed monocytes interact with PDGFβR+ cells, which form scaffold-like structures. (c) Effect of CCR2+ monocyte administration on stroke outcome in CCR2fl/flLysMcre+ recipient mice. For treatment controls, we administered monocytes obtained from donor mice of the same genotype as the recipient mice. Behavioral tests conducted at 1d, 4d and 8d post-ischemia showed no differences in the Pole test or the Rotarod test in Ccr2fl/flLysMcre+ mice injected with either Ccr2+/+ (n = 17) or Ccr2–/– (n = 15) monocytes, as analyzed with two-way ANOVA by treatment and time with a subject-matching design. (d) Likewise, MRI infarct volume (%) 24 h post-ischemia showed no differences between treatment groups. (e) Gene expression eight days post-ischemia in the ipsilateral cortex of Ccr2fl/flLysMcre+ mice that received administration of either Ccr2fl/flLysMcre+ monocytes (n = 7) (treatment control) or Ccr2+/+ monocytes (n = 7) shows no differences between groups (Mann-Whitney test). Fold increases are calculated versus non-ischemic cortex of Ccr2fl/flLysMcre– mice. Scale bar: 10 µm.

