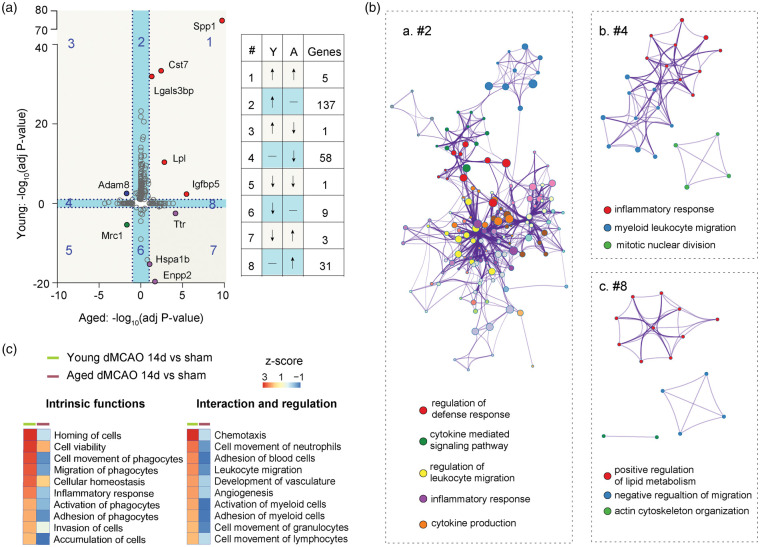
Figure 3.
Microglia demonstrate age-dependent transcriptional profiles and functional alterations 14 days after stroke. (a) Scatterplot shows comparison of −log10(adjusted Pval) for DEGs in young and aged microglia at 14 days after stroke. The DEG distributions within each subgroup (1–8) are listed in a table on the right. Quadrants 1, 3, 5, and 7 (with light grey background) indicate DEGs in both young and aged microglia. Quadrants 2, 4, 6, and 8 with light blue background indicate genes significantly changed in either young or aged group. (b) Metascape enrichment analysis for genes in second (a), fourth (b) and eighth (c) quadrants. Each node indicates a term. Clustering was made based on similarity (similarity > 0.3). (c) Function enrichment analysis performed by IPA identifies differences in intrinsic functions (left) and regulatory functions (right) between young and aged microglia. Functional terms were sorted according to z-score (high to low) in the young microglia.

