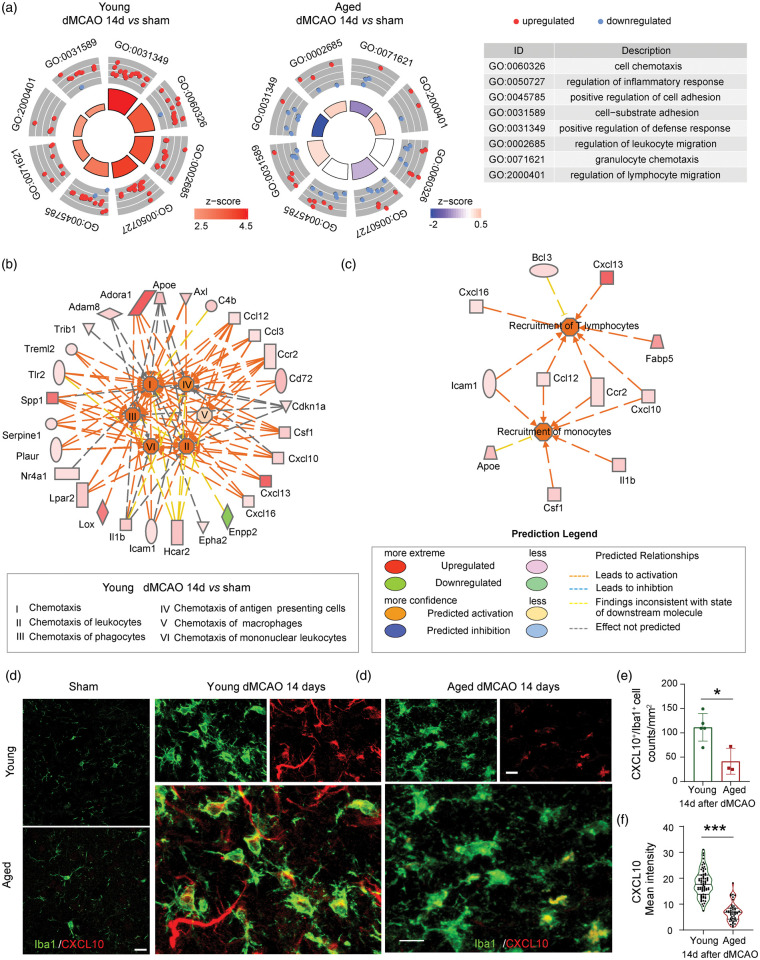
Figure 5.
Aged microglia show reduced capacities for cell–cell interaction and regulation compared to young counterparts 14 days after stroke. (a) Circle plot shows eight cell-cell interaction related GO terms in young (left) and aged (middle) group. The outer circle shows a scatterplot for each term with log2(fold change) of assigned genes. Red dots indicate upregulated genes, and blue dots indicate downregulated genes. The color of the inner circle displays the z-score, with the area of trapeziform indicating the p value of each term. The table shows the description of each term. (b) IPA analysis identified chemotaxis-related functions enriched in young microglia. The color of the outer circle nodes indicates the expression of assigned genes. The color of the inner circle nodes indicates the z-scores of enriched functions. The color of segments between gene nodes or function nodes implies gene activation or inhibition. Red indicates upregulation and green indicates downregulation. (c) Genes related to recruitment of T lymphocyte and monocytes were upregulated in young microglia 14 days after stroke. (d) Immunostaining of CXCL10 (red) and Iba1 (green). The left panels (bar = 20 µm) show the staining in young and aged sham. The middle and right panels (bar = 10 µm) show the staining in young and aged mice, respectively, 14 days after stroke. (e) Quantification of the number of CXCL10+Iba1+ microglia in young and aged mice 14 days after stroke. n = 5 for young and n = 3 for aged. *p < 0.05, Student’s t test. (f) Quantification of the mean intensity of CXCL10 signal in Iba1+ microglia. Violin plots are shown, with n = 71 cells for young and n = 47 cells for aged. ***p < 0.001. Mann-Whitney U test.

