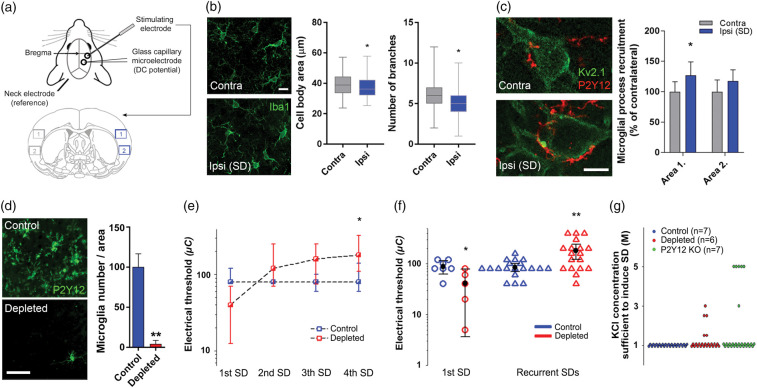
Figure 1.
Spreading depolarization (SD) attracts microglial processes to neuronal somata and selective elimination of microglia alters the electrical threshold of SD elicitation. (a) Schematic illustration of the experimental setting in series 1, and areas of quantification for the immunofluorescent analysis shown in Panels (b) and (c). Area size (420 µm × 320 µm). (b) Changes in microglial cell body area and the number of branches as obtained from 2D morphological analysis of Iba1-positive microglia in the cerebral cortex (the region used for analysis is identical to Area 1 shown in panel (a)). Mann–Whitney U test (p < 0.05*). Scale bar, 10 μm. (c) Representative images demonstrating microglial (P2Y12R, red) process recruitment to Kv2.1 labeled neuronal soma (green) in the neocortex, contralateral and ipsilateral to SD elicitation. Microglial process density is increased around neurons in the ipsilateral cortex relative to the contralateral cortex in Area 1 (near SD induction) depicted in Panel A. Data are expressed as mean±stdev. Control vs. ipsi p < 0.01, two-way ANOVA followed by Sidak’s multiple comparison test (p < 0.05 for Area 1). Scale bar, 10 μm. (d) Representative images and quantitative analysis confirming elimination of microglia (P2Y12 receptors, green) after feeding mice a PLX5622 (1200 ppm)-containing diet for three weeks. Data are expressed as mean±stdev. Unpaired t-test (p < 0.01**). Scale bar, 50 μm. (e) Microglia depletion increased the electric threshold of SD elicitation for each consecutive SD in a train (Series 1). Data are shown as median and interquartile ranges. Friedman ANOVA for time (p < 0.05* vs. 1st SD, in the depleted group), and a Mann–Whitney U test for group comparison (no significant differences between groups). (f) Microglia depletion altered the electric threshold of SD elicitation (series 1). First SDs (circles) are shown apart from pooled, recurrent SDs (triangles). Black circle and error bars stand for mean ± 95% CI. Mann–Whitney U test (p < 0.05* and p < 0.01** vs. respective Control). (g) The induction of SD required a KCl concentration higher than 1 M in some of the microglia-depleted and P2Y12R KO animals (series 2). Each colored sphere in the graph stands for the induction of an individual SD.

