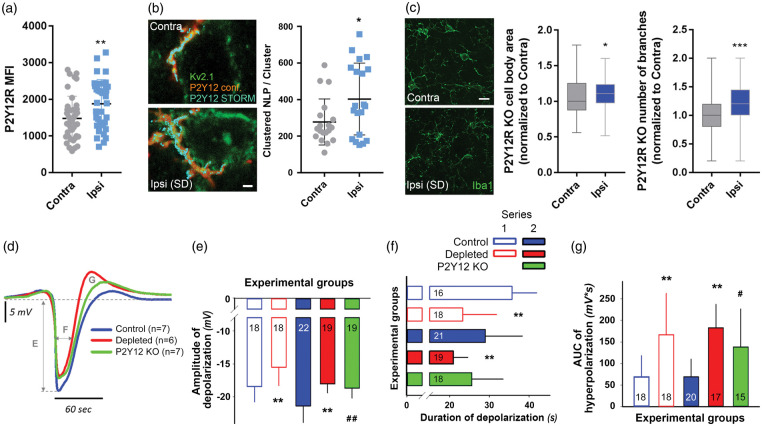
Figure 2.
Selective elimination of microglia or absence of P2Y12R curbs SD and supports hyperpolarization after SD. (a) Confocal analysis revealed increased microglial P2Y12R mean fluorescence intensity (MFI) in response to a series of SDs (assessed in Area 1 according to Figure 1(a)). Unpaired t-test, n = 40 randomly selected microglia from the contralateral hemisphere and n = 38 microglia from the ipsilateral hemisphere from seven mice per group. (b) Representative images depict the enrichment of P2Y12R (STORM, cyan) on microglial processes (P2Y12R, confocal, red) recruited to the Kv2.1 (green) labeled neurons in the neocortex, contralateral and ipsilateral to SD elicitation. Scale bar, 1000 nm. STORM super-resolution microscopy reveals increased P2Y12R densities on microglial processes recruited to neurons, in response to SD. Mean±stdev values of the number of localization points (NLP) are shown normalized to P2Y12R clusters determined by the density-based spatial clustering of applications with noise (DBSCAN) algorithm (Local density filter: 10 neighbours within 150 nm Z-filter: ±300 nm from focal plane). Unpaired t test, p < 0.05*, n = 20 neurons randomly selected from seven mice per group. (c) Changes in microglial cell body area and the number of branches in P2Y12R KO mice as obtained from 2D morphological analysis of Iba1-positive microglia in the cerebral cortex (the region used for analysis is identical to Area 1 shown on Figure 1 Panel (a)). Values normalized to the contralateral side are shown as median±interquartile range. Mann–Whitney U test, (p < 0.05*). Scale bar, 10 μm. (d) The direct current (DC) potential signature of recurrent SDs (rSDs) (each trace is the mean of rSDs in each experimental group, series 2). Capital letters indicate variables quantitated in the respective Panels. (e) Amplitude of the negative DC potential shift of rSDs (series 1 and 2). (f) Duration of the negative DC potential shift of rSDs (series 1 and 2). (g) Area under the curve of the hyperpolarization after rSDs (series 1 and 2). In Panels (d)–(f), data are given as mean±stdev. Sample size is indicated in each bar. Statistical analysis of data in series 1 relied on an independent t-test or a Welch-t test. Data in series 2 were evaluated by a one-way ANOVA paradigm followed by a multiple comparison of Tukey for equal variances, or Games-Howell for unequal variances (p < 0.01** depleted vs. respective control, p < 0.05# and p < 0.01## P2Y12R KO vs. respective control).

