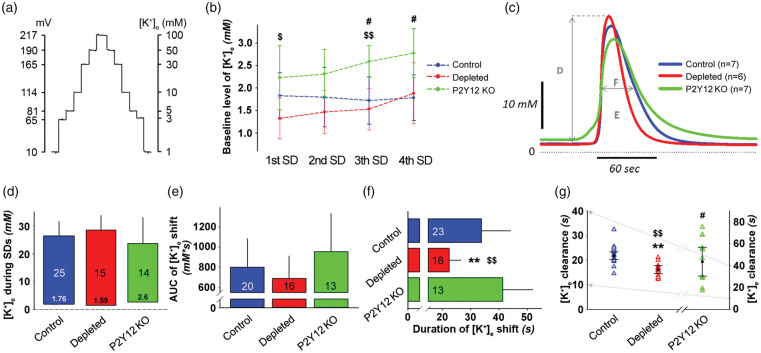
Figure 3.
Selective elimination of microglia shortens the duration of spreading depolarization (SD)-related potassium elevation. (a) Calibration curve for the K+-selective microelectrodes using K+ solution standards (1, 3, 5, 10, 30, 50, and 100 mM KCl). Microelectrodes were calibrated before and after each in vivo measurement. (b) Baseline level of extracellular potassium concentration ([K+]e) (mean of 60 s) immediately before the induction of each SD. Data are given as mean±stdev. Repeated measures ANOVA for within group variation, and one-way ANOVA followed by Tukey’s multiple comparison for group evaluation (p < 0.05$ and p < 0.01$$ P2Y12R KO vs. depleted, p < 0.05# P2Y12R KO vs. control). (c) The transient increase of [K+]e with recurrent SDs (rSDs) (each trace is the mean of rSDs in each experimental group, series 2). Capital letters indicate variables quantitated in the respective Panels. (d) Peak elevation of the [K+]e shift with rSDs. The base of each bar in the chart is set at [K+]e immediately prior to rSDs. (e) Magnitude of the [K+]e shift with rSDs, expressed as area under the curve (AUC). (f) Duration of the [K+]e shift with rSDs, taken at half amplitude. (g) [K+]e clearance, calculated by an exponential regression at half-time recovery of [K+]e to baseline. In Panels (d)–(f), data are given as mean±stdev. Sample size is indicated in each bar. In Panel (g), triangles denote individual values, while black circle and error bars stand for mean±CI. Note, that the y-axis for control and depleted (left) is an expanded segment of the y-axis (right) for P2Y12R KO (grey arrows). One-way ANOVA followed by Tukey’s multiple comparison for equal variances, or Games-Howell for unequal variances (p < 0.01** Depleted vs. control, p < 0.05$ and p < 0.01$$ P2Y12R KO vs. depleted, p < 0.05# P2Y12R KO vs. Control).

