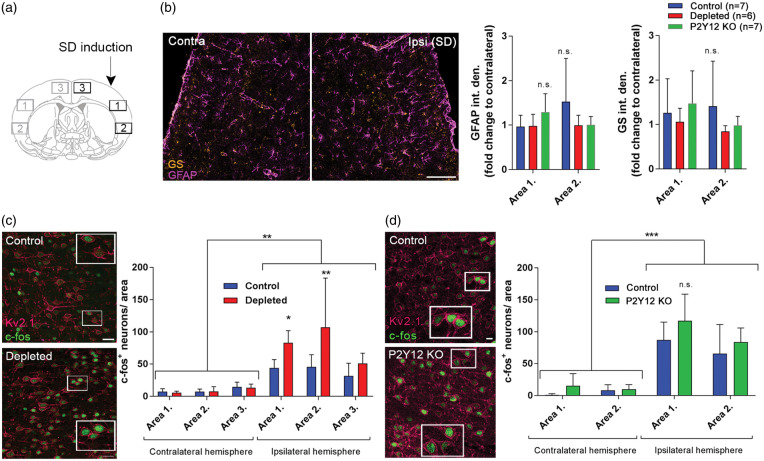
Figure 4.
The absence of microglia is associated with augmented neuronal activation after spreading depolarization (SD). (a) Schematic showing the areas used for quantitative analysis relative to the site of SD induction. (b) Representative images showing glial fibrillary acidic protein (GFAP) and glutamine synthetase (GS) immunofluorescence in the ipsilateral hemisphere 1.5 h after SD induction (Area 1 is displayed). Graphs showing integrated density values of GFAP and GS signal normalized to the corresponding areas of the contralateral hemisphere as mean±stdev. Two-way ANOVA followed by Sidak’s multiple comparison. (c) Representative images demonstrate activated, c-fos labeled (green) neurons (Kv2.1, a voltage-dependent K+ channel; magenta) in the cerebral cortex ipsilateral to SD elicitation (mean±stdev). Mice were sacrificed 1.5 h after the induction of the first SD in a train of four events, to allow the assessment of c-fos protein expression. Scale bar, 10 µm. Quantification of c-fos protein expression was performed in areas indicated in the schematic coronal brain section in Panel (a) (ROI: 300 µm × 200 µm). p < 0.01**, control vs. depleted (ipsilaterally), two-way ANOVA followed by Sidak’s multiple comparison. (d) Representative images demonstrate activated, c-fos labeled (green) neurons (Kv2.1, magenta) in the cerebral cortex ipsilateral to SD elicitation in control and P2Y12R KO mice (Area 1 on panel A is shown). Quantification of c-fos protein expression was performed in areas indicated in the schematic coronal brain section in Panel (a) (ROI: 300 µm × 200 µm, only Area 1 and Area 2 assessed based on the results of microglia depletion studies). n = 4–7, data are expressed mean±stdev.

