Figure 1.
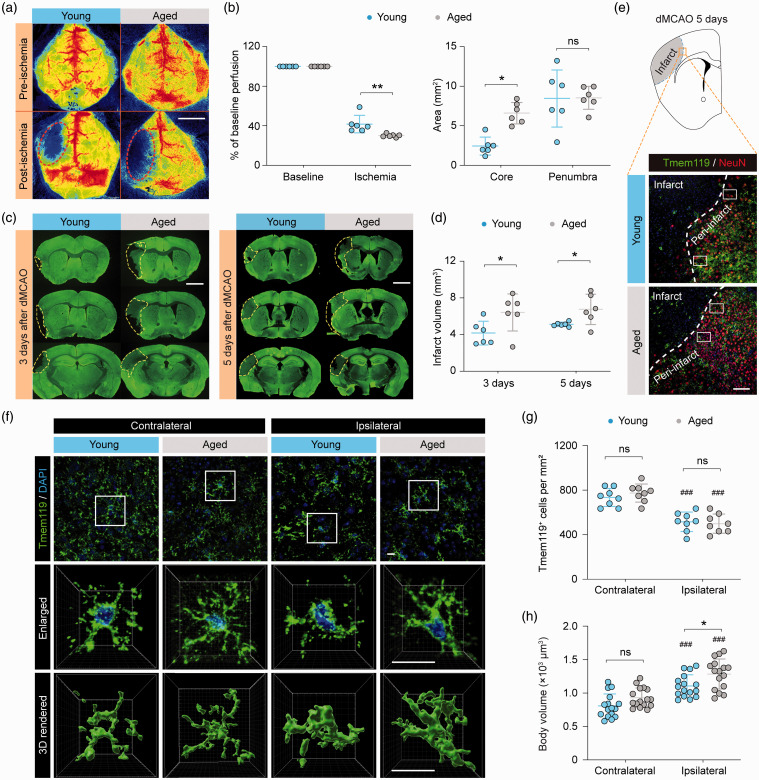
Morphological differences between young and aged microglia in response to ischemic stroke. Young adult (8–10 weeks old) and aged (18 months old) mice were subjected to dMCAO. (a,b) Cortical CBF was monitored by two-dimensional laser speckle imaging. (a) Representative laser speckle images show cortical CBF before (baseline) and 10 min after dMCAO. Dashed lines: the approximate boundaries of the ischemic area. (b) Summarized data on mean cortical CBF (left panel) and areas of the ischemic core (CBF reduction of >70% of baseline) and penumbra (CBF reduction of 50–70% of baseline; right panel). n = 6 mice per group. (c) Brain infarct volumes were assessed three and five days after dMCAO on MAP2 (green)-immunostained coronal brain sections. Dashed lines demarcate infarct in the left hemisphere. n = 6 mice per group. (e–g) Microglial morphology was assessed five days after dMCAO on Tmem119-immunostained brain sections. (e) Representative images of Tmem119 and NeuN double-label immunofluorescence depict the peri-infarct regions in the ipsilesional hemisphere (rectangles) where images in (f) were captured. Dashed line: the approximate infarct boundary defined by the dramatic reduction of NeuN immunofluorescence. (f) Representative images showing Tmem119 immunofluorescence in the ipsilesional peri-infarct areas and in the corresponding regions in the non-injured contralateral hemisphere five days after dMCAO. Cells were counterstained with DAPI for nuclear labeling. Rectangles: regions that were enlarged (2nd row) and 3D-rendered by Imaris (3rd row). (g,h) The numbers and body volumes of Tmem119+ cells were quantified. n = 8 mice per group (g) or 16 cells from 4 mice per group (h). ###P<0.001 vs. contralateral side. *P<0.05, **P<0.01, aged vs. young. ns, no significant difference. Scale bars: 4 mm (a), 2 mm (c), 100 μm (e), and 10 μm (f).

