Figure 7.
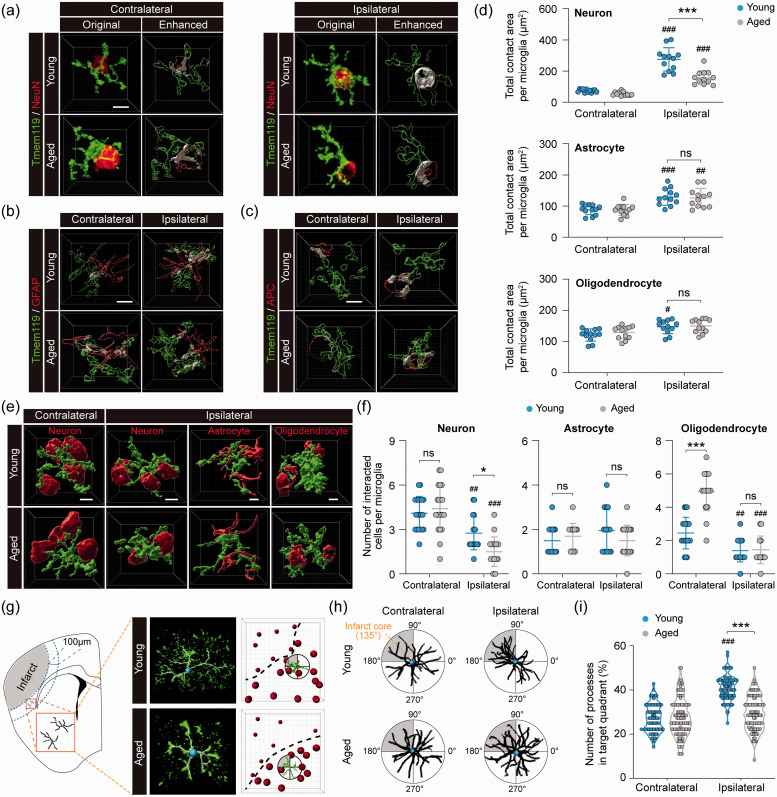
Aged microglia demonstrate reduced interactive responses to ischemic neurons and infarct in the post-stroke brain. Young adult and aged mice were subjected to dMCAO. The interaction between microglia and neighboring brain cells was examined by immunofluorescence staining five days after dMCAO in the ipsilesional peri-infarct regions and corresponding regions in the non-injured contralateral hemisphere. (a) Original images from confocal microscopy and Imaris-enhanced images showing the cell–cell contact areas between Tmem119+ microglia and NeuN+ neurons in white color. (b,c) Imaris-enhanced images showing the cell–cell contact areas between Tmem119+ microglia and GFAP+ astrocytes (b) or APC+ oligodendrocytes (c). See Supplementary Figure 5(a) to (c) for all original immunofluorescence images. (d) Summarized data of total contact area with neurons, astrocytes and oligodendrocytes per microglia. n = 12 cells from four mice per group. (e) Representative immunofluorescence images that were surface rendered by Imaris illustrate the cell–cell interaction between microglia (green) and neurons, astrocytes or oligodendrocytes (red). See Supplementary Figure 5(d) for original immunofluorescence images. (f) Summarized data on the numbers of neurons, astrocytes and oligodendrocytes each microglia interacted with. n = 20 cells from four mice per group. (g) The polarity of Tmem119+ microglia in the ipsilateral peri-infarct region (0–100 µm from the infarct border) was assessed in an arbitrary polar coordinate system. The direction from the microglia cell body to the infarct core was defined as 135°, and the quadrant from 90° to 180° was defined as the target quadrant toward the infarct core. (h) Tmem119 immunofluorescence was converted into binary signals to illustrate the direction of cellular processes. Shown is the overlay of three representative cells in each group. (i) The number of processes in the target quadrant was quantified and expressed as percentage of total processes in all four quadrants. n = 100 cells from four mice per group. #P<0.05, ##P<0.01, ###P<0.001 ipsilateral vs. contralateral. *P<0.05, ***P<0.001 aged vs. young. ns: no significant difference. Scale bars: 5 µm.

