
Fig. 4 |. oviDNs integrate mating status and substrate signals via distinct upstream pathways.
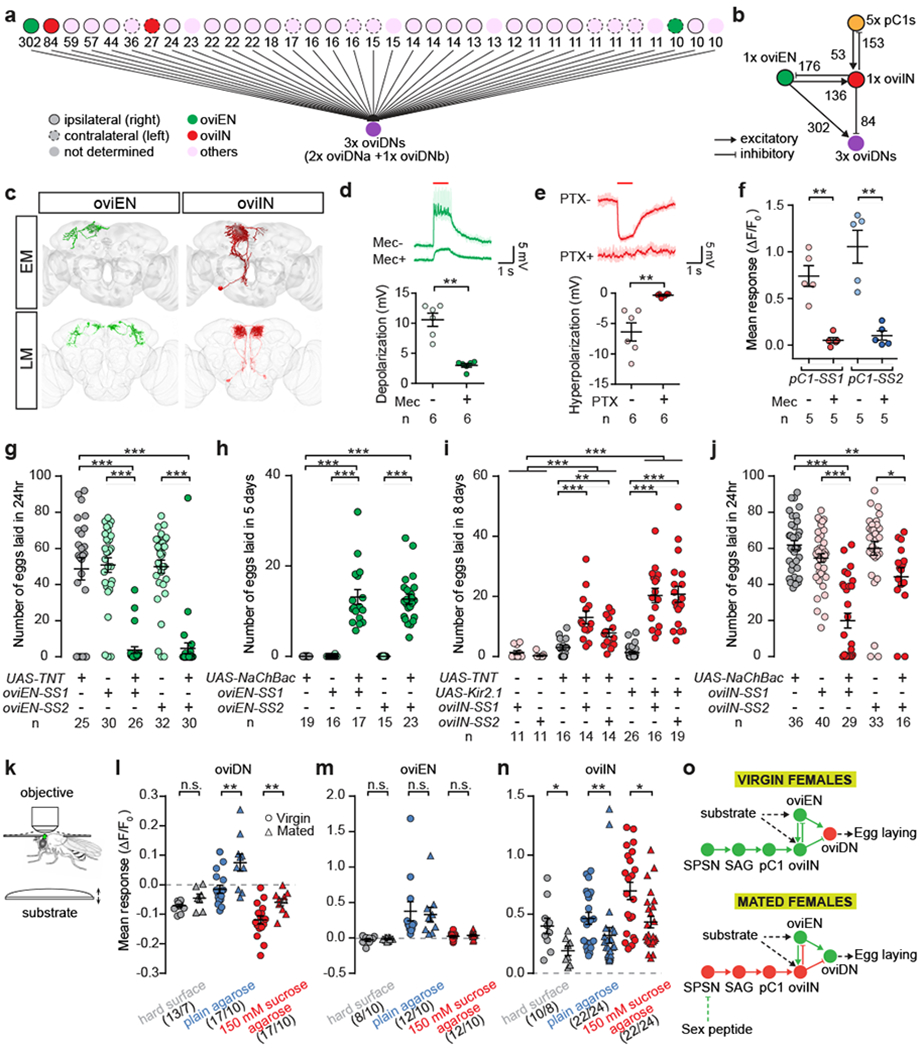
a, Upstream neurons of three oviDNs identified by EM reconstruction, showing the number of oviDN input synapses. b, Synaptic connectivity amongst 4 cell types in the right hemisphere. c, EM reconstructions (top) and confocal images (bottom) of oviENs and oviINs. d, e, Example traces and plots of membrane potential changes in oviDNs evoked by photoactivating (1 s at 625 nm) oviENs (d) or oviINs (e), before and after application of mecamylamine (Mec) or picrotoxin (PTX). f, GCaMP6s signal changes in oviINs in response to photoactivation of pC1 neurons. g-j, Number of eggs laid by mated females in 24 hr after mating (g, j), or by virgin females in 5 d (h) or 8 d (i) after eclosion. k, Schematic of the in vivo Ca2+ imaging experiment. The brain of a female with partially removed head cuticle (green oval) is imaged as substrates are presented to the legs sequentially via an elevator platform. l-n, GCaMP6s signal changes in virgin or mated females. o, Model for the coordination of mating and egg-laying. Solid lines indicate monosynaptic connections. Data shown as scatter plots with mean ± s.e.m. in d-j and l-m. *, P < 0.05, **, P < 0.01, ***, P < 0.001, Wilcoxon test.