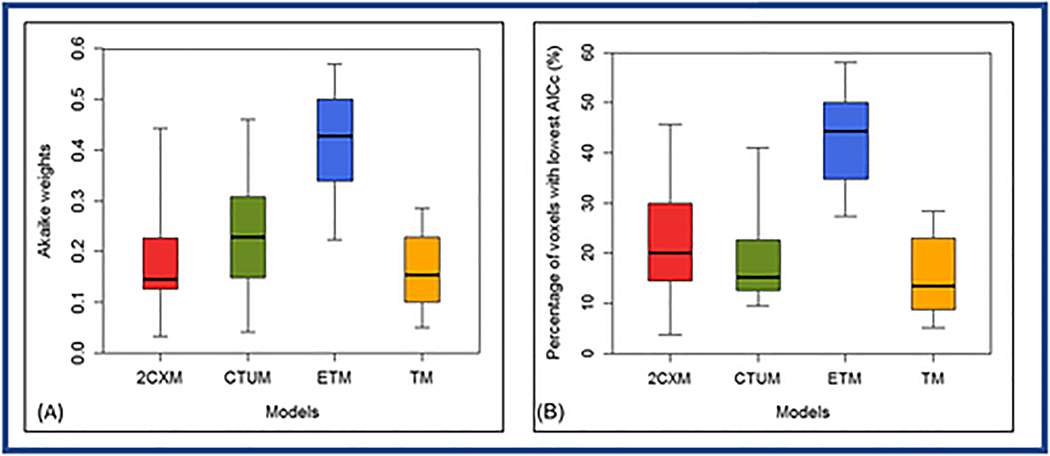
Figure 5.
Box-and-whisker plot comparing the Akaike weights (A) and percentage of voxels (B) with the lowest Akaike information Criterion AICc within the region of interest (ROI) for the two-compartment exchange model (2CXM), compartmental tissue uptake model (CTUM), extended Tofts model (ETM), and Tofts model (TM), from 18 papillary thyroid cancer patients. Each box plot shows minimum, first quartile, median (black line), third quartile, and maximum values. ETM estimated percentage of voxels with the lowest AICc were significantly different from 2CXM, CTUM, and TM (ANOVA, P<0.0001).

