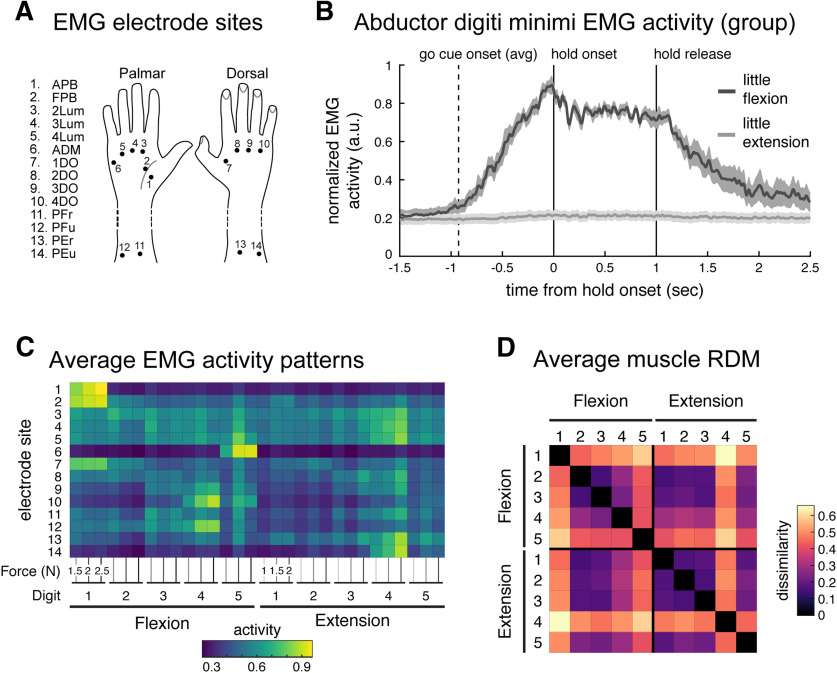
Figure 4.
Quantifying similarity of muscle activity patterns during finger flexion and extension. A, Fourteen surface electrode sites. B, Group averaged normalized EMG (normalized, per participant, to peak activity from this electrode across trials) from the ADM muscle during 2 N little finger (5) flexion (dark gray) and extension (light gray) trials, aligned to hold onset (0 s). During extension movement (light gray trace, >1000 ms), this flexor muscle was not recruited. Shaded areas reflect SEM. Traces were smoothed with a Gaussian kernel (FWHM, 25ms). C, Average muscle activity across participants, normalized by peak activation across conditions (per participant), recorded from the 14 electrode sites during the flexion extension task. Each condition was measured under three force conditions. D, Group average RDM of the muscle activity patterns. As in Figure 2, the RDM is plotted as square root dissimilarities to aid visual inspection.

