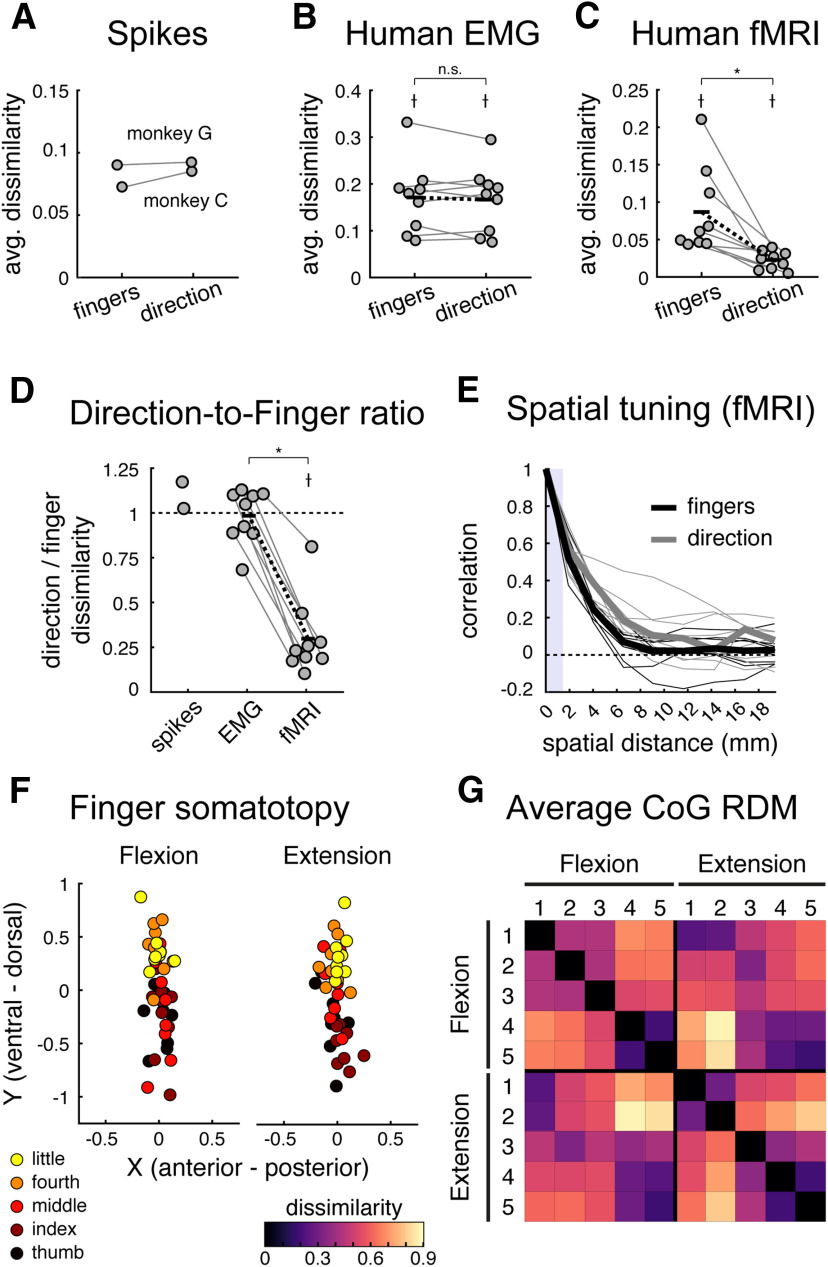
Figure 6.
Comparing strength of finger and direction representations across datasets. A–C, The average finger- and direction-specific dissimilarities for the spiking (A), human EMG (B), and human fMRI (C) datasets. Each dot denotes one participant, and lines connect dots from the same participants. Black bars denote the means, and black dashed lines reflect the mean paired differences. †Dissimilarities significantly larger than zero (one-sided t test, p < 0.05); *significant difference between finger and direction dissimilarities (two-sided paired t test, p < 0.05). D, The ratio of the direction-to-finger dissimilarities for each dataset. Values <1 indicate stronger finger representation. †Dissimilarities significantly lower than one (one-sided t test, p < 0.05); *significant differences between dissimilarity ratios (two-sided paired t test, p < 0.05); n.s., not significant (p > 0.05). E, Estimated spatial autocorrelations of finger (black) and direction (gray) pattern components in human M1, plotted as a function of spatial distance between voxels. No significant difference was observed between finger and direction tuning in M1. The thick lines denote the median spatial autocorrelation functions, and small lines are drawn for each participant for each pattern component. The vertical shaded bar denotes the distance between voxel size, for which correlations can be induced by motion correction. F, CoG of activation elicited by single finger presses in the flexion or extension direction for each participant. CoGs were aligned across participants before plotting by subtracting the center of the informative region within each participant (i.e., the mean CoG across all conditions). A somatotopic gradient for finger flexion and extension in Brodmann area 4a is visible with the thumb being more ventral, and the little finger more dorsal. G, Group average RDM of the paired Euclidean distance between condition CoGs.

