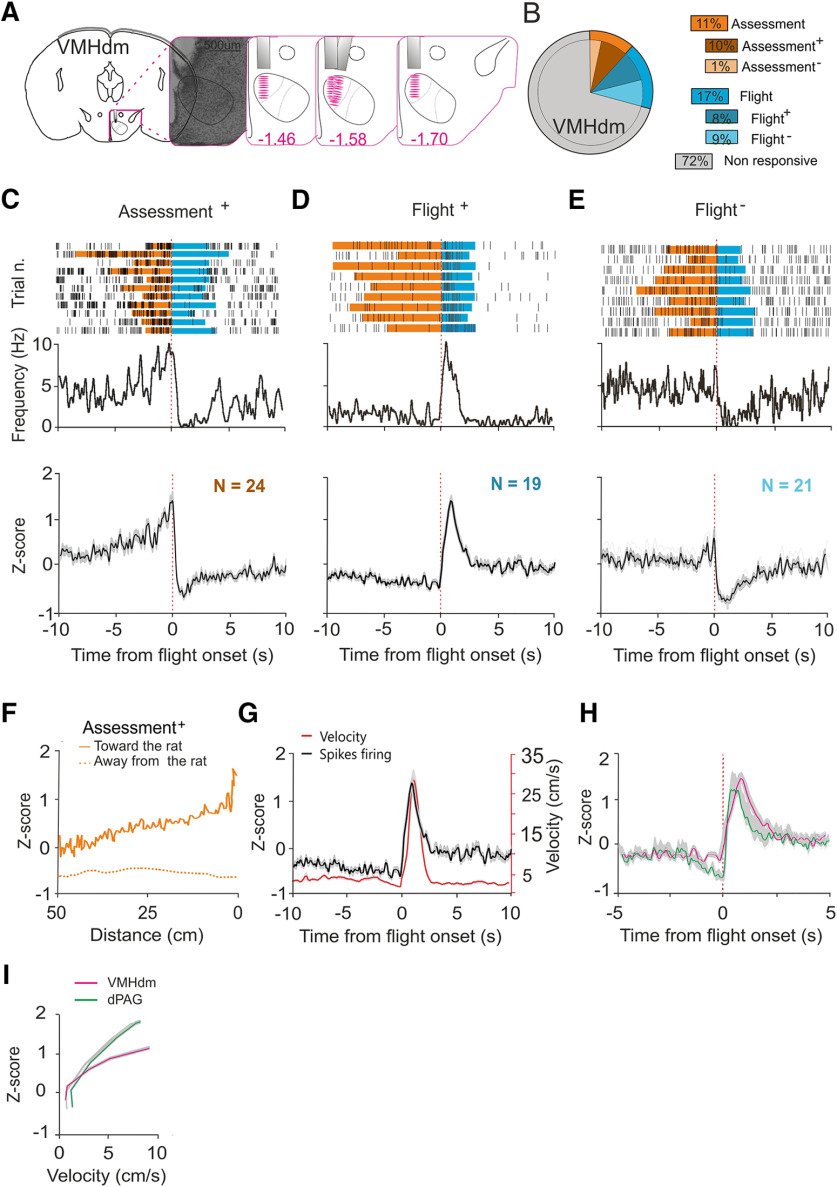
Figure 3.
Single unit activity in VMHdm during exposure to predator. A, Nissl staining showing representative electrolytic lesion in VMHdm and estimated electrode recording sites. B, Population distribution of single units identified in VMHdm (11% assessment, 17% flight, mice N = 4, cells N = 236). Sorting examples can be found in Extended Data Figure 3-1. C, Firing frequency of a representative assessment+ cell over trials (top). Normalized average firing rate of all assessment+ cells identified (bottom, N = 24). D, Firing frequency of a representative flight+ cell over trials (top). Normalized average firing rate of all flight+ cells identified (bottom, N = 19). E, Firing frequency of a representative flight– cell over trials (top). Normalized average firing rate of all identified flight– cells (bottom, N = 21). F, Normalized firing rates of assessment+ cells plotted against distance from the rat chamber. Continuous line indicates firing rate during approach and dashed line indicates firing rate during flight. G, Average firing activity of flight+ cells and mouse velocity during flight. H, Normalized firing rate of flight+ cells in dPAG (green) and VMHdm (magenta) during flight. I, Average firing activity of flight+ cells in dPAG (green) and VMHdm (magenta) plotted against average velocity during flight. Time zero represents flight onset.

