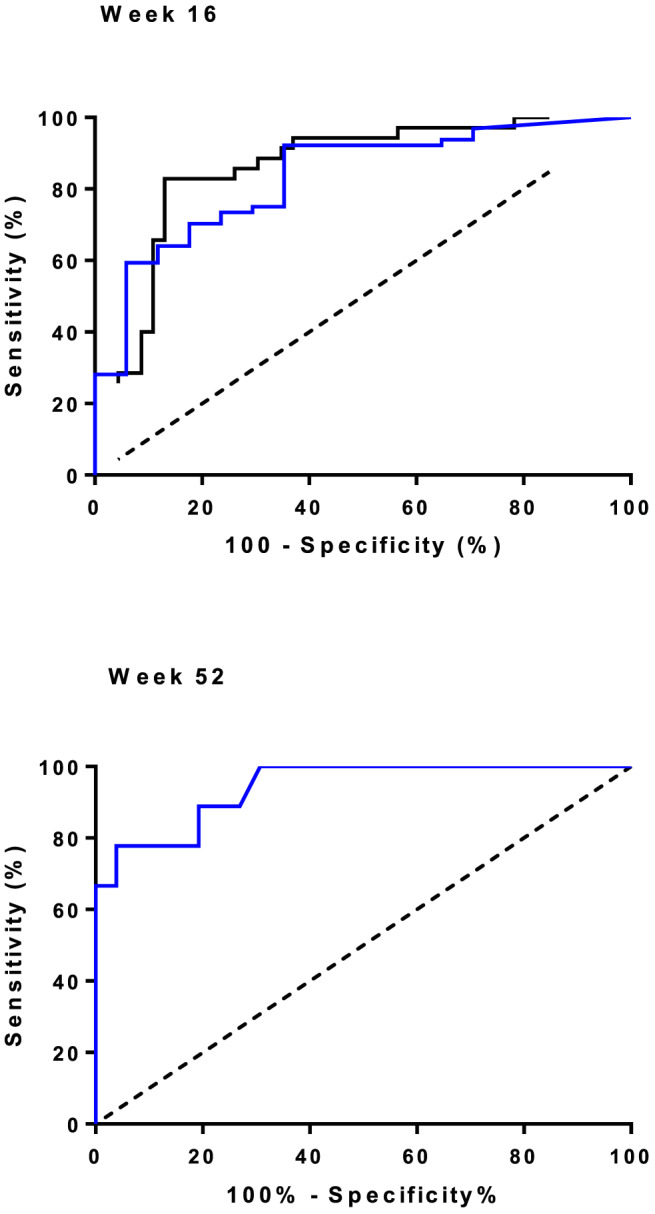
Figure 2.

Association between fecal calprotectin (μg/g) and endoscopic response to vedolizumab at weeks 16 and 52. Receiver operating characteristic curves for the optimal fecal calprotectin cut‐off value to predict endoscopic response after vedolizumab induction at week 16 and week 52. The area under the curve for endoscopic response at week 16 = 0.860, for endoscopic remission at week 16 = 0828, and for sustained endoscopic response at week 52 = 0.942. Upper panel:  , endoscopic response;
 , endoscopic remission. Lower panel:
  , sustained endoscopic response. [Color figure can be viewed at wileyonlinelibrary.com]
