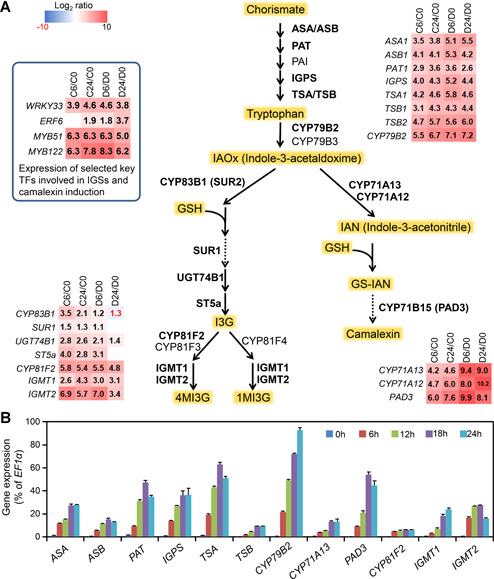
Figure 2.

Coordinated up‐regulation of genes in the IGS and camalexin biosynthetic pathways after gain‐of‐function activation of CPK5
(A) Schematic diagram of IGS and camalexin biosynthetic pathways. Changes of gene expression (in folds relative to 0 h samples, i.e., before treatment) are shown as a heatmap. C0, C6, and C24 are samples from CPK5‐VK plants before (0 h) or 6 h and 24 h after DEX treatment, respectively. D0, D6, and D24 are samples from DD plant before (0 h) or 6 h and 24 h after DEX treatment, respectively. Solid arrows indicate single enzymatic steps, whereas dashed lines stand for multiple enzymatic steps. Enzymes marked in bold font have elevated expression after CPK5 activation. (B) Activation of CPK5 induces up‐regulation of gens in IGS and camalexin biosynthesis pathway. Twelve‐d‐old CPK5‐VK plants grown in liquid medium were treated with 5 μM DEX for indicated times. Transcript levels were quantified by RT‐qPCR and calculated as percentages of the EF1α transcript. Values are means ± SD, n = 3.
