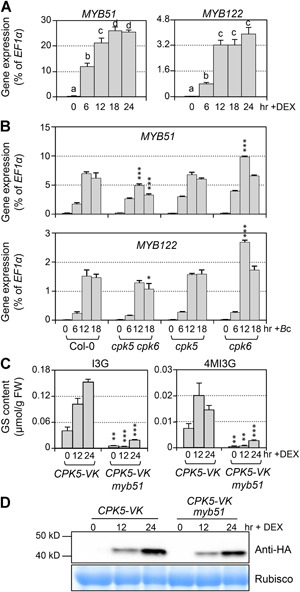
Figure 6.

MYB51 is downstream of CPK5/CPK6 in B. cinerea‐induced IGS biosynthesis
(A) Twelve‐d‐old CPK5‐VK plants grown in liquid medium were treated with 5 μM DEX for indicated times. Transcript levels were quantified by RT‐qPCR and calculated as percentages of the EF1α transcript. Values are means ± SD, n = 3. One‐way ANOVA was performed to compare gene expression level at different time point after treatment. Lowercase letters above the columns indicate statistically different time points (P < 0.05). (B) Twelve‐d‐old Col‐0, cpk5 cpk6, cpk5, and cpk6 plants grown in liquid medium were treated with B. cinerea spores (4×10⁵ spores/mL) for indicated times. Transcript levels were quantified by RT‐qPCR and calculated as percentages of the EF1α transcript. Values are means ± SD, n = 3. One‐way ANOVA was performed to compare the levels of each gene expression between each mutant and Col‐0 at 12 h and 18 h, *P < 0.05, ***P < 0.001. (C) Twelve‐d‐old CPK5‐VK and CPK5‐VK myb51 plants grown in liquid medium were treated with 5 μM DEX. Levels of I3G and 4MI3G were measured at indicated time points. Values are means ± SD, n = 3. Student t‐test was performed to compare the levels of I3G or 4MI3G between CPK5‐VK and CPK5‐VK myb51 at each time point, **P < 0.01, ***P < 0.001. (D) CPK5‐VK protein in WT and myb51 background was detected by western blot to show the same induction. CBB (Coomassie brilliant blue) staining was used to show equal loading.
