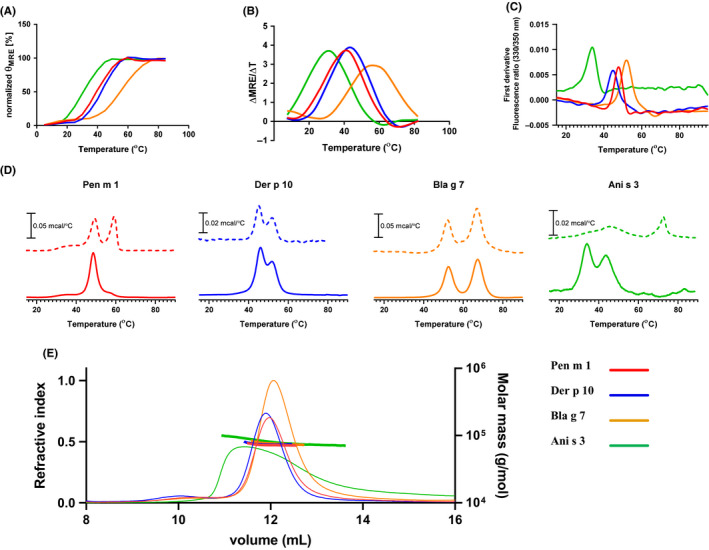
Figure 2.

Structural characterization of tropomyosins. Analysis of thermal stability of Pen m 1, Der p 10, Bla g 7, and Ani s 3 using (A) CD spectroscopy, observing changes in MRE at 222 nm, and (B) first derivative of MRE from 15 to 85°C. Analysis of thermal stability by using (C) DSF and (D) observing changes in heat capacity using (DSC) at pH 5.2 (dotted line) and pH 7.4 (solid line). E, Analysis of tropomyosins by SEC‐MALS indicated molar masses consistent with essentially full occupancy of dimer at pH 7.4. The RI chromatograms on the left axis (thin lines) while the evaluated molar masses shown with the right axis (thick horizontal lines)
