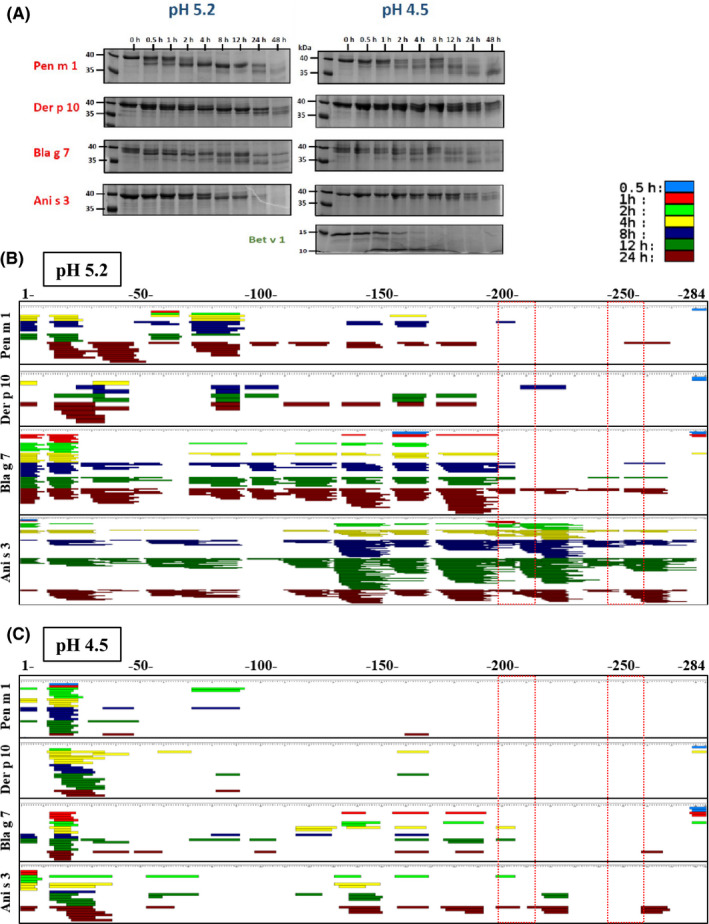
Figure 3.

Endolysosomal degradation of tropomyosins using the microsomal fraction of murine dendritic cells (JAWS II) to mimic degradation in antigen‐presenting cells. Coomassie‐stained SDS‐PAGE gel of time‐dependent digestion products of tropomyosins over 48 h; lane 1 indicates molecular ladder (A). Mass spectrometric sequencing of endosomal digestion‐generated tropomyosin peptides mapped against the whole amino acid sequence (numbered 1‐284) for tropomyosins under acidic condition at pH 5.2 (B) and pH 4.5 (C). Peptides generated at various time‐points are depicted in various colors (see color key). Regions corresponding to the immunoreactive Pen m 1 peptides; 67 and 82 are highlighted (dashed boxes)
