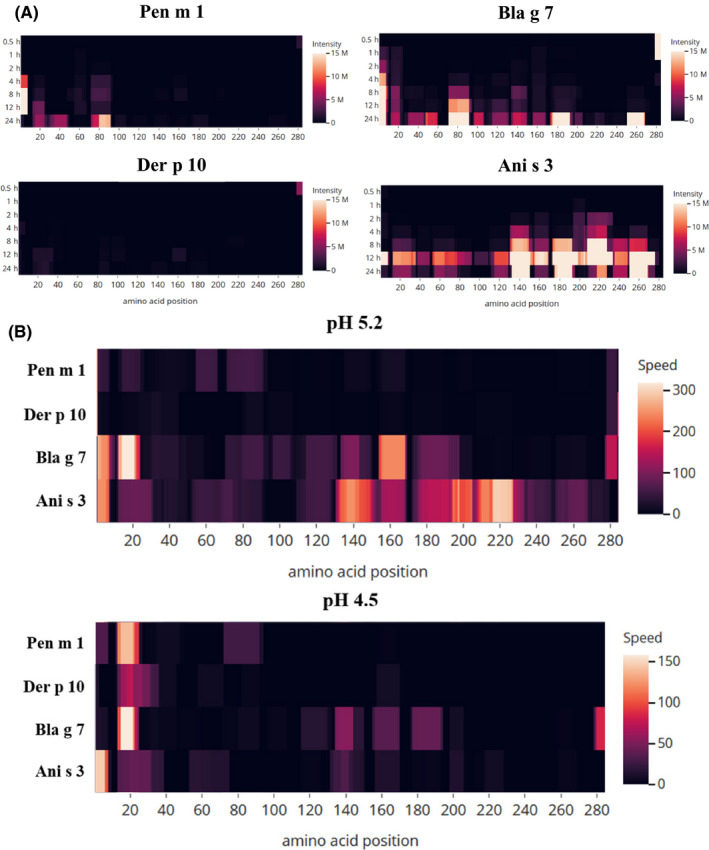
Figure 4.

Peptide heat map depicting the intensity at pH 5.2 (A) and speed (B) of generation of tropomyosin‐derived peptides during the endolysosomal degradation assay under acidic conditions. The heat map indicates the position and abundance of the generated peptides as sequenced by mass spectrometric analysis, mapped against the full‐length amino acid sequence of the different tropomyosins
