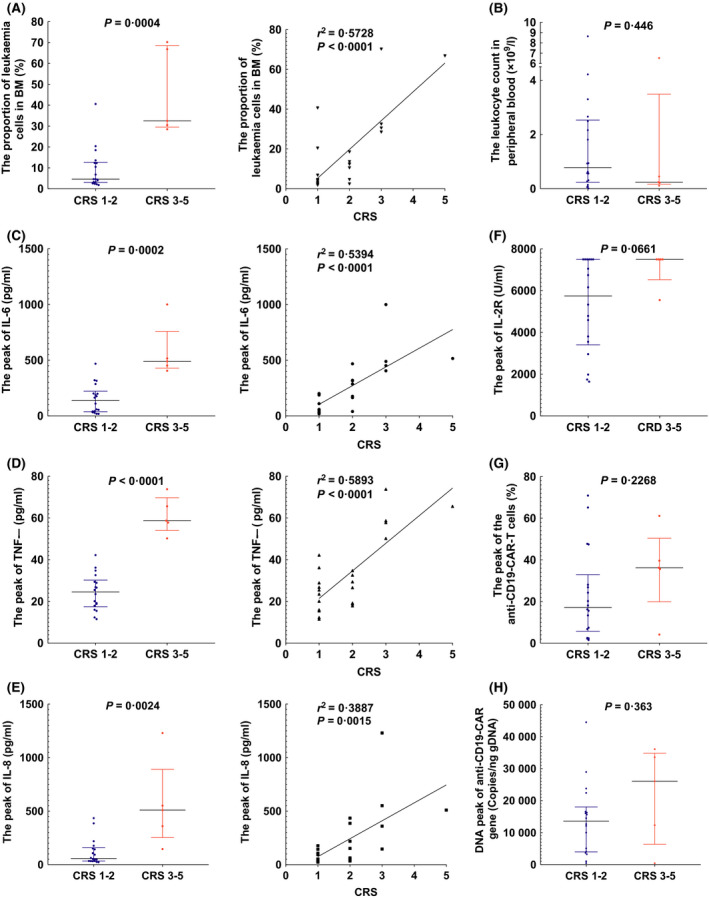
Fig 6.

Factors in anti‐CD19‐CAR‐T‐cell therapy related to cytokine release syndrome (CRS) levels. (A) The proportion of leukaemic cells in bone marrow (BM) correlated with CRS levels [4·6% (IQR 3·1–12·7) to 32·5% (IQR 29·5–68·5)]. (B) The leukocyte count in peripheral was not correlated with CRS levels [0·8 × 109/l (IQR 0·3–2·5) to 0·2 × 109/l (IQR 0·2–3·5)]. (C) The peak of IL‐6 level correlated with CRS levels [137·0 pg/ml (IQR 37·9–222·3) to 489·5 pg/ml (IQR 428·5–758·0)]. (D) The peak of TNF‐α level correlated with CRS levels [24·5 pg/ml (IQR 17·4–30·2) to 58·7 pg/ml (IQR 54·0–69·7)]. (E) The peak of IL‐8 level correlated with CRS levels [57·6 pg/ml (IQR 34·1–158·3) to 510·0 pg/mL (IQR 253·0–890·5)]. (F) The peak of IL‐2R level was not correlated with CRS levels [5,747 U/ml (IQR 3,404–7,500) to 7,500 U/ml (IQR 6,525–7,500)]. (G) The peak proportion of the anti‐CD19‐CAR‐T cells was not correlated with CRS levels [17·2% (IQR 5·7–32· 9) to 36·2% (IQR 19. 9–50·4)]. (H) The peak of anti‐CD19‐CAR gene level was not correlated with CRS levels [13,578 Copies/ng gDNA (IQR 3,949–18,009) to 26,045 Copies/ng gDNA (IQR 6,363–34,819)].
