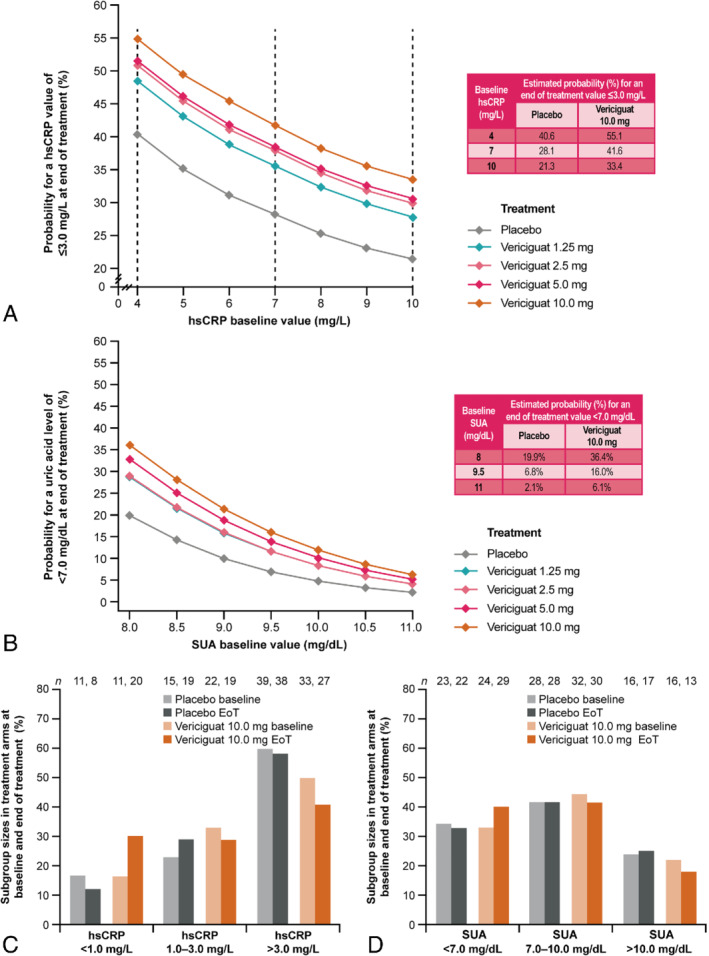
Figure 2.

Estimated probabilities for (A) high‐sensitivity C‐reactive protein (hsCRP) and (B) serum uric acid (SUA) reduction to below risk level and (C, D) subgroup sizes per treatment arm at baseline and end of treatment (EoT). In (B), 1.25 mg and 2.5 mg vericiguat trend lines overlap SUA data. Numbers within the bar charts represent the numbers of patients with specified (C) hsCRP or (D) SUA values at baseline or EoT. The total numbers of patients per treatment arm for placebo and vericiguat 10.0 mg were 65 and 66, respectively, for hsCRP data, and 67 and 72, respectively, for SUA data.
