
Figure 4.
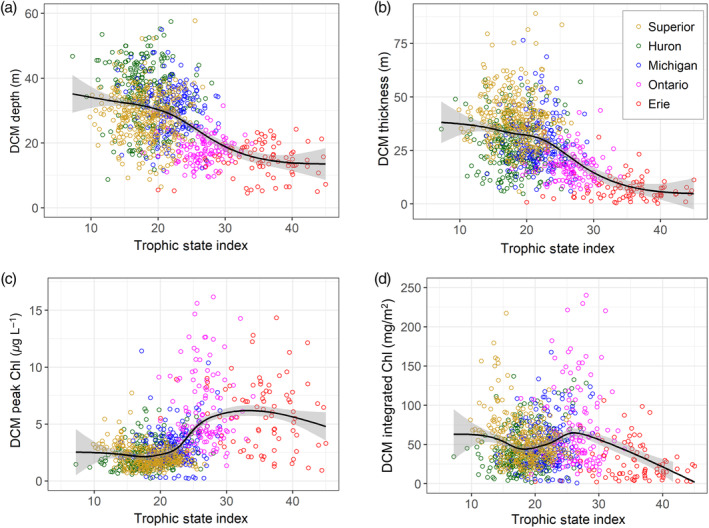
Characteristics of deep chlorophyll maxima (DCM) in the Great Lakes vs. trophic state index (TSI) calculated from mean of TSI from chlorophyll and total phosphorus concentrations the prior spring season (Carlson 1977). (a) Depth of the DCM (m); (b) thickness of the DCM (m); (c) chlorophyll concentration (μg L−1) at the DCM peak; (d) integrated chlorophyll for the full depth range of the DCM feature (mg m−2). All dependent variables were calculated from corrected chlorophyll profiles based on data from 1996 to 2017. The smoothed line represents a generalized additive model with confidence intervals, generated within the R package ggplot2 (Wickham 2016).