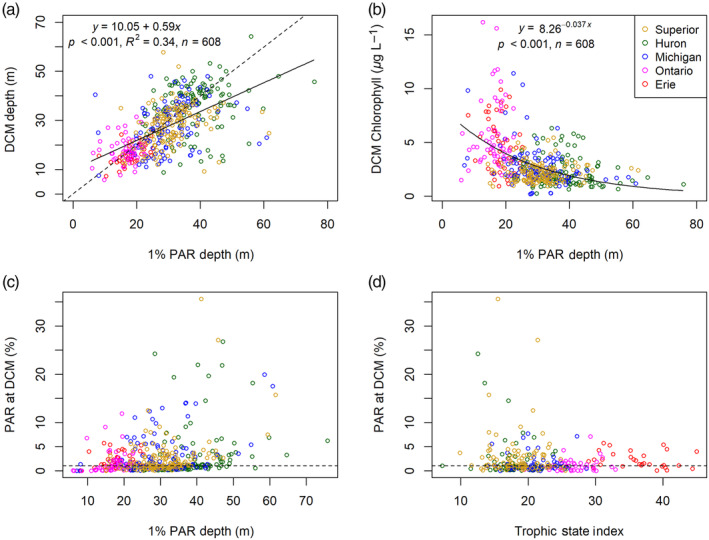
Figure 8.

Relationships showing the importance of water clarity for determining deep chlorophyll maximum (DCM) characteristics. (a) DCM depth vs. 1% PAR depth (z 1%), including the 1 : 1 line (dotted line) and linear regression (solid line); (b) DCM chlorophyll (μg L−1) vs. z 1% with a nonlinear fit (c) Percent surface PAR at the DCM vs. z 1%; (d) Percent surface PAR at the DCM vs. trophic state index.
