
Figure 9.
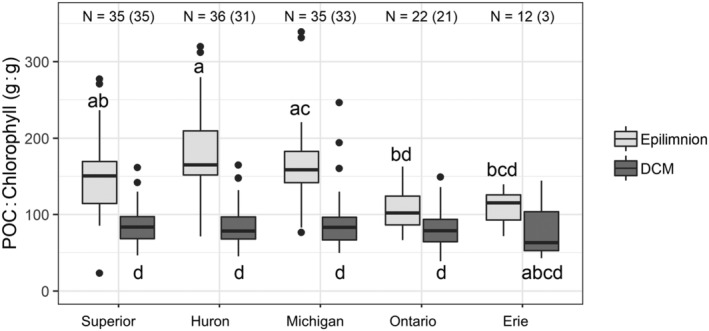
Particular organic carbon (POC) to chlorophyll ratios for the epilimnion and deep chlorophyll maximum (DCM) by lake, based on POC and extracted chlorophyll concentrations at master stations (Fig. 1) from 2000 to 2014. Boxes show the first and third quartiles with the median (line), whiskers extend to most extreme data point within 1.5 times the interquartile range from the box, and dots show outliers. Sample size is noted for samples from the epilimnion and DCM (in parentheses). Letters indicate significantly different groups based on pairwise comparisons after a significant Kruskal–Wallis test (Giraudoux 2018).