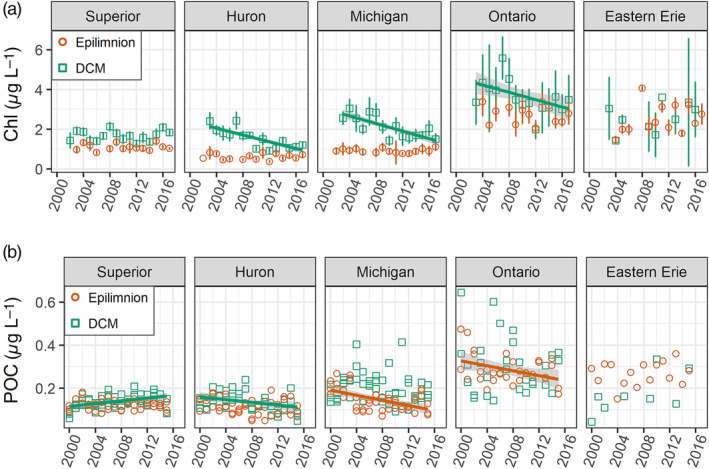
Figure 11.

August time series for data for the epilimnion and the deep chlorophyll maximum (DCM): (a) chlorophyll concentration (mean ± two standard errors), and (b) particulate organic carbon (POC, all data for master stations only). Lines show significant linear trends. Data source EPA‐GLNPO GLENDA data base (https://cdx.epa.gov/).
