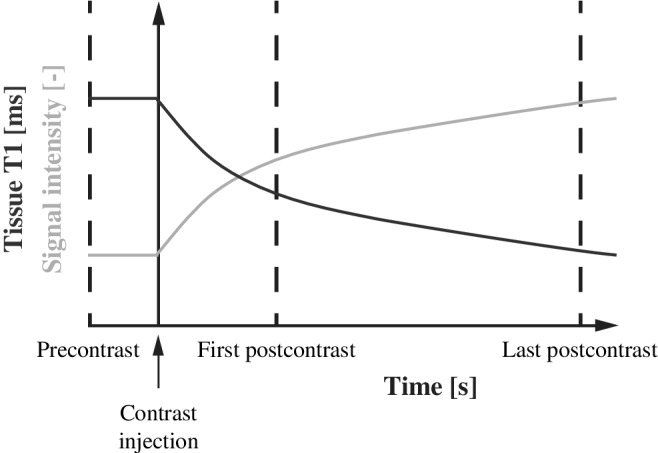
FIGURE 1.

Illustration of the continuous decrease of T1 in the breast parenchyma (vertical axis, blue line) over time (horizontal axis) after contrast injection. As a result of decreasing T1, the signal intensity in these voxels increases (vertical axis, gold line). The parenchymal enhancement biomarker is defined as the top‐10% relative increase between the first and last postcontrast scan.
