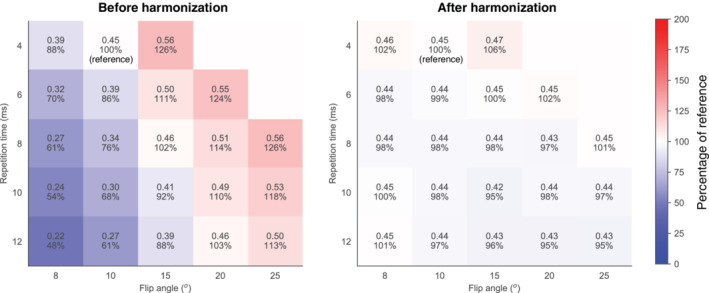
FIGURE 3.

Parenchymal enhancement simulated at various flip angles and TRs before (left) and after harmonization (right). The reference situation was at flip angle of 10° and TR of 4 msec. The median (interquartile range (IQR)) of the simulations was 0.46 (0.34–0.54) before harmonization (left image) and 0.44 (0.44–0.46) after harmonization (right image). The colors are based on the percentages compared to the reference.
