
FIGURE 4.
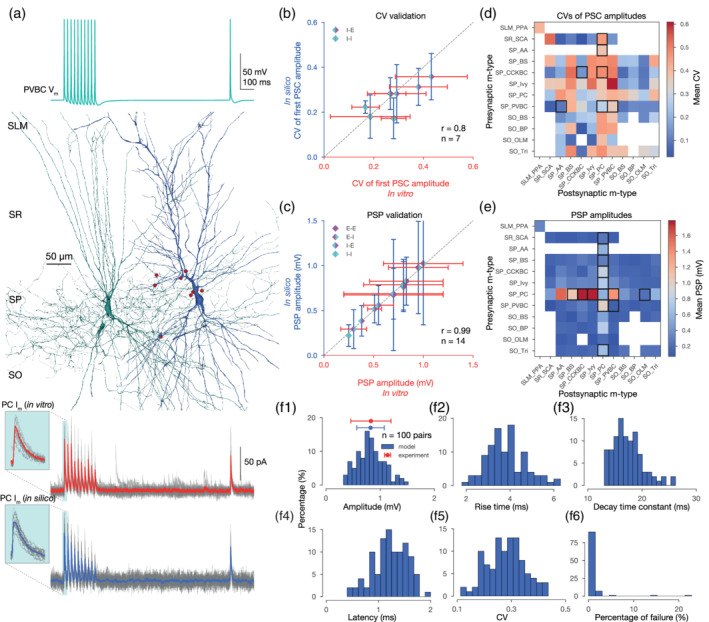
In silico synapse physiology. (a) In silico paired recording experiment with the STP protocol used in Kohus et al. (2016). Presynaptic (PVBC) voltage trace is shown on top. In silico PVBC (green) to PC (blue) pair, with synapses visualized in red in the middle. 3D morphologies were reconstructed with the Neurolucida software by the members of the Thomson/Mercer lab (Migliore et al., 2018). Postsynaptic (PC) experimental traces recorded in vitro (in gray) and their mean in red, as well as model traces recorded in silico (in gray) and their mean in blue, are presented at the bottom panel. Insets show the variance of the first IPSCs. (b) Validation of the CV of the first PSC amplitudes (excluding failures) against experimental data. (E: excitatory, I: inhibitory, e.g.,: I‐E: inhibitory to excitatory pathways.) Dashed gray line represents perfect correlation between experimental and model values. (c) Validation of the postsynaptic potential (PSP) amplitudes against experimental data. (d) Predicted CVs of first PSC amplitudes (excluding failures) for all pathways in the CA1 network model after synapse parameter generalization. As in Figure 3c, only connections with ≤200 μm intersomatic distance were used to calculate the average postsynaptic response from n = 20 pairs with 35 repetitions for each pair. Postsynaptic cells were held at −65 mV in in silico voltage‐clamp mode. M‐type abbreviations, white boxes, and black rectangles are as in Figure 3c. (e) Predicted PSP amplitudes for all pathways in the CA1 network model after synapse parameter generalization. Then, 20 pairs with 35 repetitions for every possible connection. Postsynaptic cells were held at −65 mV steady‐state potential in in silico current‐clamp mode. Consistent with Gulyás et al. (1993), PC to interneurons are the strongest. M‐type abbreviations, white boxes, black rectangles and number of pairs are as in (d). (f) Properties of postsynaptic (PC) IPSPs from 100 PVBC to PC pairs with 35 repetitions each. (f1) Distribution of in silico PSP amplitudes. In vitro experimental data from Pawelzik et al. (2002) is indicated in red. (f2) Distribution of in silico PSP 10–90% rise times. (10–90% rise time constants of PSCs are fixed to 0.2 ms in the model, but the PSP rise times wary.) (f3) Distribution of in silico PSP decay time constants (single exponential fit). (f4) Distribution of in silico PSP latencies. (f5) Distribution of the CVs of the first in silico PSP amplitudes (excluding failures). (f6) Distribution in silico failures (0 measurable PSP amplitude from 35 repetitions) [Color figure can be viewed at wileyonlinelibrary.com]