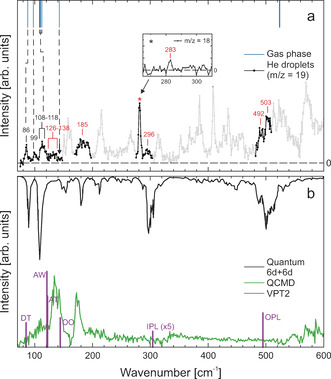
Figure 1.

a) Overview of the FIR/THz depletion spectrum of the water cluster (H2O)2 in helium nanodroplets recorded at m/z=19 (lower trace, shown in gray). Bands that were assigned to water dimer are highlighted in black. The signal marked with a “*” is composed of water dimer, trimer, and higher clusters. For an assignment, we also recorded a depletion spectrum at m/z=18 (see inset), which minimizes water trimer contributions. Peak positions are given in cm−1. For comparison, we show the results of previous gas‐phase studies[ 29 , 31 , 43 , 44 , 45 ] as blue lines (upper trace). Black numbers correspond to bands observed in previous gas‐phase studies, while red numbers correspond to newly assigned bands. b) Predictions of the low‐frequency spectrum; black line: quantum 6d+6d (upper trace); green line: QCMD calculations (lower trace) both using the HBB2 12d ab initio potential and dipole moments; and purple sticks previous VPT2 calculations [46] (lower trace).
