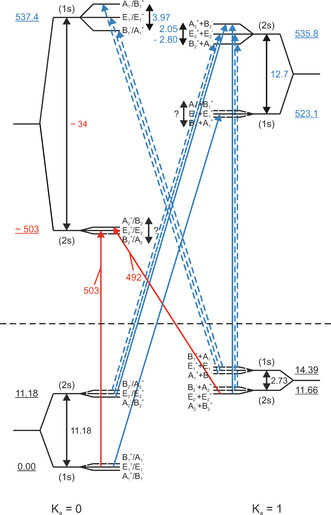
Figure 5.

Out‐of‐plane libration (OPL) VRT energy level diagram. Parallel and perpendicular transitions are shown as vertical and diagonal arrows, respectively; red arrows: observed in the present study; blue arrows: previously observed in gas‐phase studies. For bands observed in the present study, the transition frequencies are given (in red). All frequencies and energies are given in cm−1.
