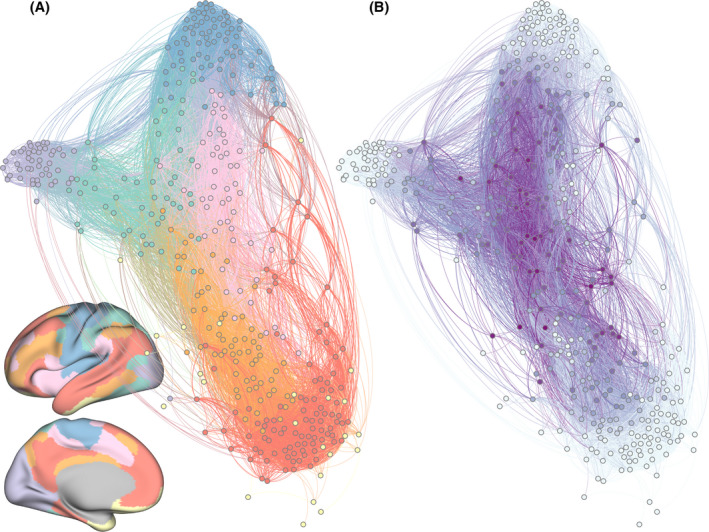
Fig. 1.

A network model of functional relationships between brain regions at the large scale in humans. Each of the 400 brain regions is represented as a network node, which in turn is indicated in this figure by a colored sphere. Each functional relationship between two brain regions is represented as a network edge, which in turn is indicated in this figure by a colored line. (A) Here, color denotes the assignment of brain regions to putative functional modules that support cognition. Anatomical locations of modules are represented by projecting the color of regions onto the cortical surface of the brain. (B) Here, color denotes the strength of the participation coefficient, a measure of a node’s connectivity to many different modules. Nodes with high participation coefficients are called connector hubs. In both of these layouts, nodes are treated as repelling magnets connected by springs; in this physical representation, nodes that are tightly connected cluster together. Note that connector hubs cluster together at the center of the network, indicative of their role in integration and coordinating brain connectivity across modules.
