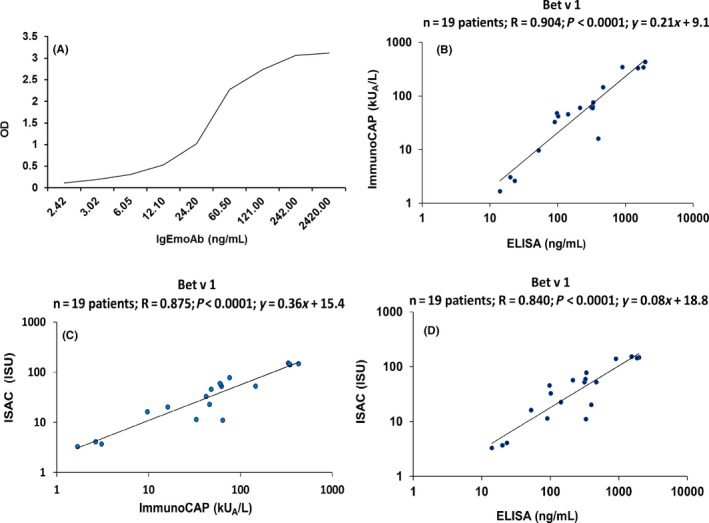
Figure 1.

Association of different concentrations of IgEmoAb (x‐axis: ng/mL) with IgE reactivities to Bet v 1 determined as optical density (OD) values (y‐axis) by ELISA (A). Correlation of Bet v 1‐specific IgE levels determined in sera from 19 birch pollen allergic patients by different methods. B, ImmunoCAP (kUA/L) (y‐axis) versus ng/ml determined by ELISA (x‐axis). C, ISU (ISAC standardized unit) values determined by ImmunoCAP ISAC (y‐axis) vs ImmunoCAP (kUA/L) (x‐axis) and D, ISU values determined by ImmunoCAP ISAC (y‐axis) vs ng/mL determined by ELISA (x‐axis). Correlation coefficients (r), regression equations, and statistical significances (P values) are shown in the top upper corner of graph
