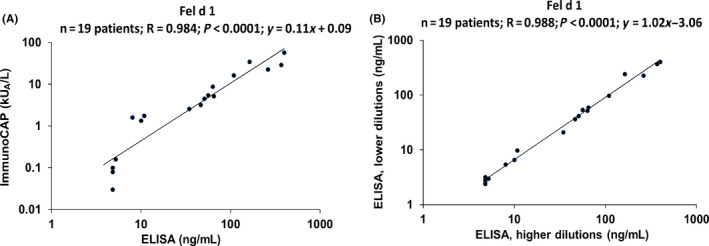
Figure 2.

Correlation of Fel d 1‐specific IgE levels determined in sera from 19 cat allergic patients by ImmunoCAP (kUA/L) (y‐axis) versus ng/ml determined by ELISA (x‐axis) (A). Correlation of Fel d 1‐specific IgE levels determined in lower (y‐axis) and higher (x‐axis) sera dilutions from 19 cat allergic patients from Table S3 (B). Correlation coefficients (r), regression equations, and statistical significances (P values) are shown in the top upper corner of graph
