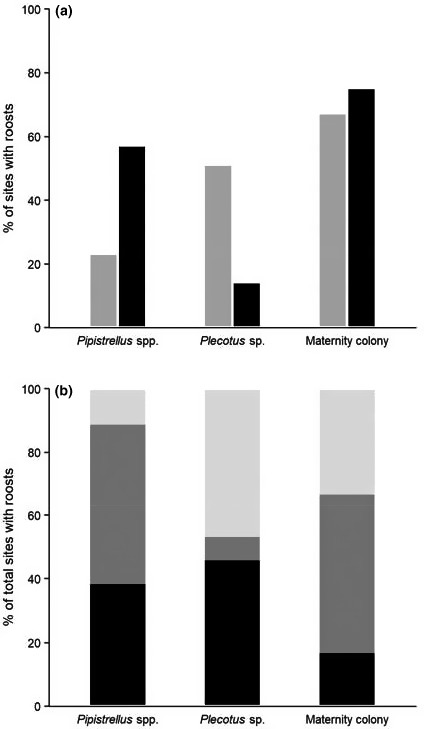
Figure 2.

(a) (1) In grey the percentage of sites with roosts detected during the preliminary roost assessment (PRA), that were not then detected by the emergence and re‐entry surveys (ERSs); and (2) in black the percentage of sites with roosts detected during the ERSs, that had not previously been detected during the PRA. (b) The percentage of total sites with roosts that were (1) discovered during the PRA but not during the ERSs (light grey); (2) discovered during the ERSs but not during the PRA (dark grey) and (3) discovered during both PRA and ERSs (black).
