
Figure 1.
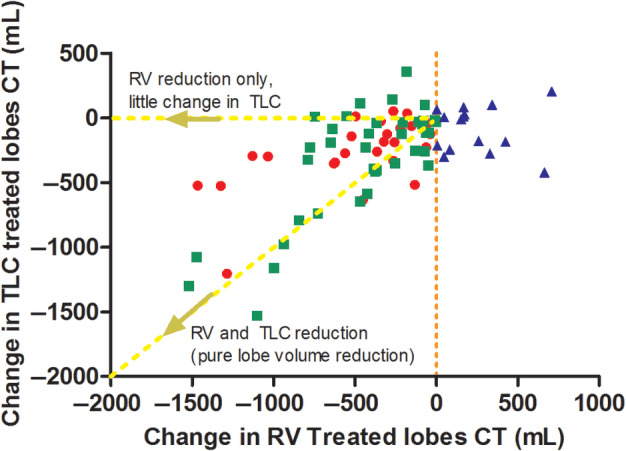
Scatterplot of change in TLC in treated lobes and change in RV in treated lobes, divided by difference in groups with different mechanisms of action and non‐responders.  , Responders without compensatory expansion;
  , responders with compensatory expansion;
  , non‐responders (no change in lobar RV). CT, computed tomography; RV, residual volume; TLC, total lung capacity.