
FIGURE 2.
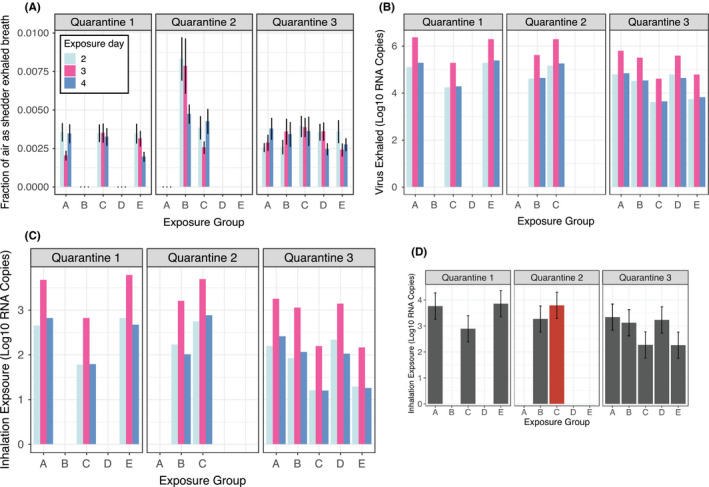
Exposure related to transmission risk. A, shows for each Recipient in each exposure group (EG), the fraction of inhaled air containing exhaled breath from Donors who shed detectable virus into fine aerosols (1 SD error bars). B, shows Donor shedding in each EG by Day, and C and D, show Recipient exposure to viral RNA aerosols in each EG by Day, and cumulatively, respectively. The single transmission event occurred in Quarantine 2 EG C, depicted in red (residual standard error bars in plot D)